Hello. Thank you to all customers who use SellerVisor.
The amount of sales and the amount deposited into your bank account are different. Amazon settlement reports record not only order payments but also sales fees, FBA fees, storage fees, refunds, advertising costs, and shipping label purchases in one file. So, when you open a settlement report, it answers the question, "Why isn't there anything left?"
SellerVisor Amazon Report Analyzer's Payment Dashboard allows you to upload a settlement CSV and organize total profit/loss and itemized expenses for the entire period on one screen.
What you need
- Seller Central → Payments → Reports Repository → Select Transaction from Report type
- Specify a period and download the CSV in English.
- If you enter the cost price per SKU, the profit reflecting the product cost, shipping cost, and advertising cost will also be calculated.
Step 1. Upload CSV on the Payment Dashboard
Select the Payment Dashboard, the third tab of the Amazon Report Analyzer, and upload your file. After uploading, click Apply to read all transactions for the period and display them divided into Summary, SKU Summary, Weekly Sales, Sum by Type, Orders by Day/Time, and Detailed Rows.
Step 2. Narrow the range with filters
Filters include Start Date, End Date, SKU, Type, Marketplace, Shipping/Handling, State, and City. If you view only 'Order' in the Type filter, you can see the sales structure; if you view only 'Refund', you can see the refund pattern; and if you view only 'Service Fee', you can separately check advertising costs and subscription fees.
Step 3. Check the final settlement amount in the summary
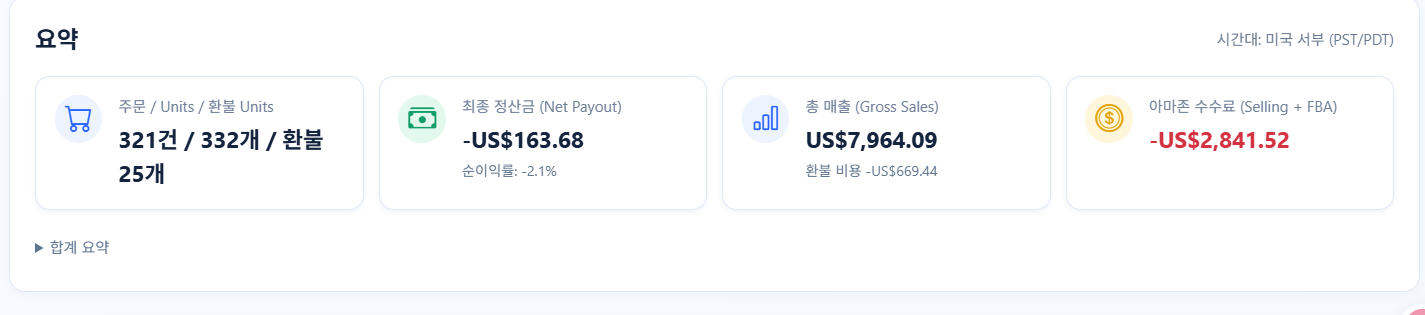
The first place to look is the summary. The numbers for the example report (October 2024 ~ February 2025) are as follows:
- 321 orders, 332 units sold, 25 refunds
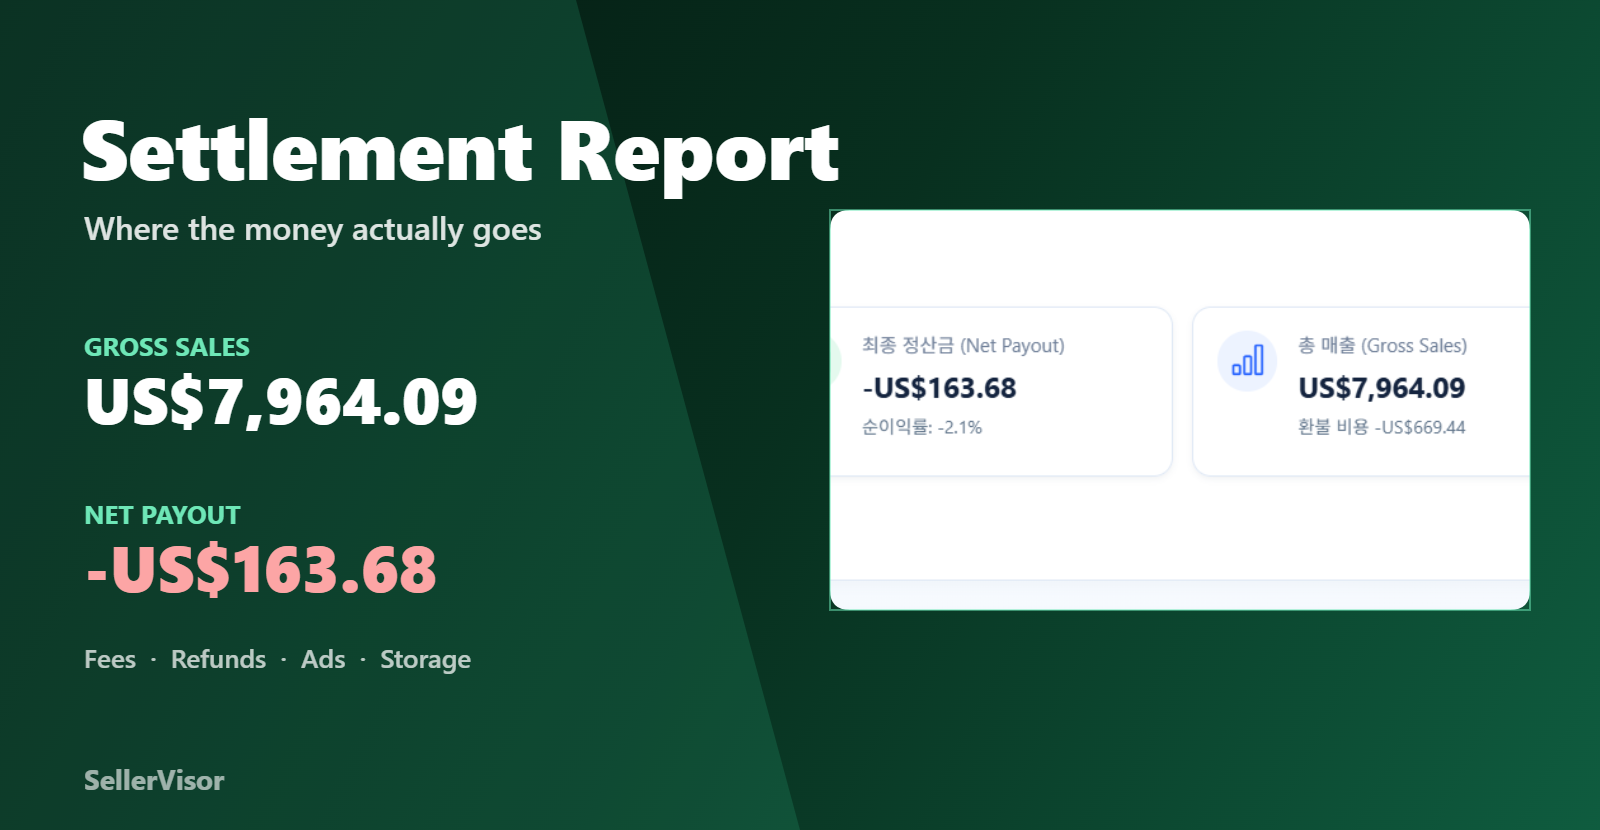
- Gross Sales $7,964.09
- Refund costs -$669.44
- Amazon fees (sales fees + FBA fees) -$2,841.52
- Final settlement amount -$163.68, Net profit margin -2.1%
While sales of $7,964 were generated over 5 months, the amount remaining in the bank account is -$163.68. If you stop here, it ends with "Amazon took it all," but if you break down the items, you can see the cause.
Step 4. Disaggregate cost items
Dividing the same report by item looks like this:
- Cost of Advertising -$2,179.56 (7 items)
- FBA storage fees and other inventory fees -$2,134.78 (10 items)
- Subscription fees -$122.72 (5 items)
- Sales fees -$1,089.79, FBA fees -$1,751.73
- Refunds -$669.44
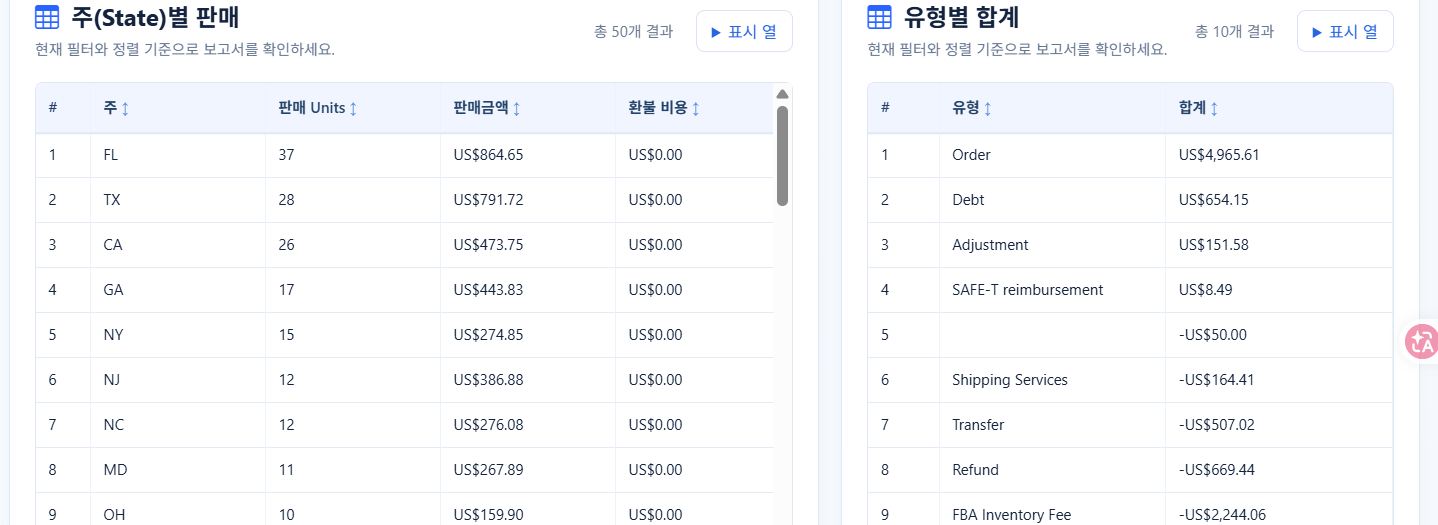
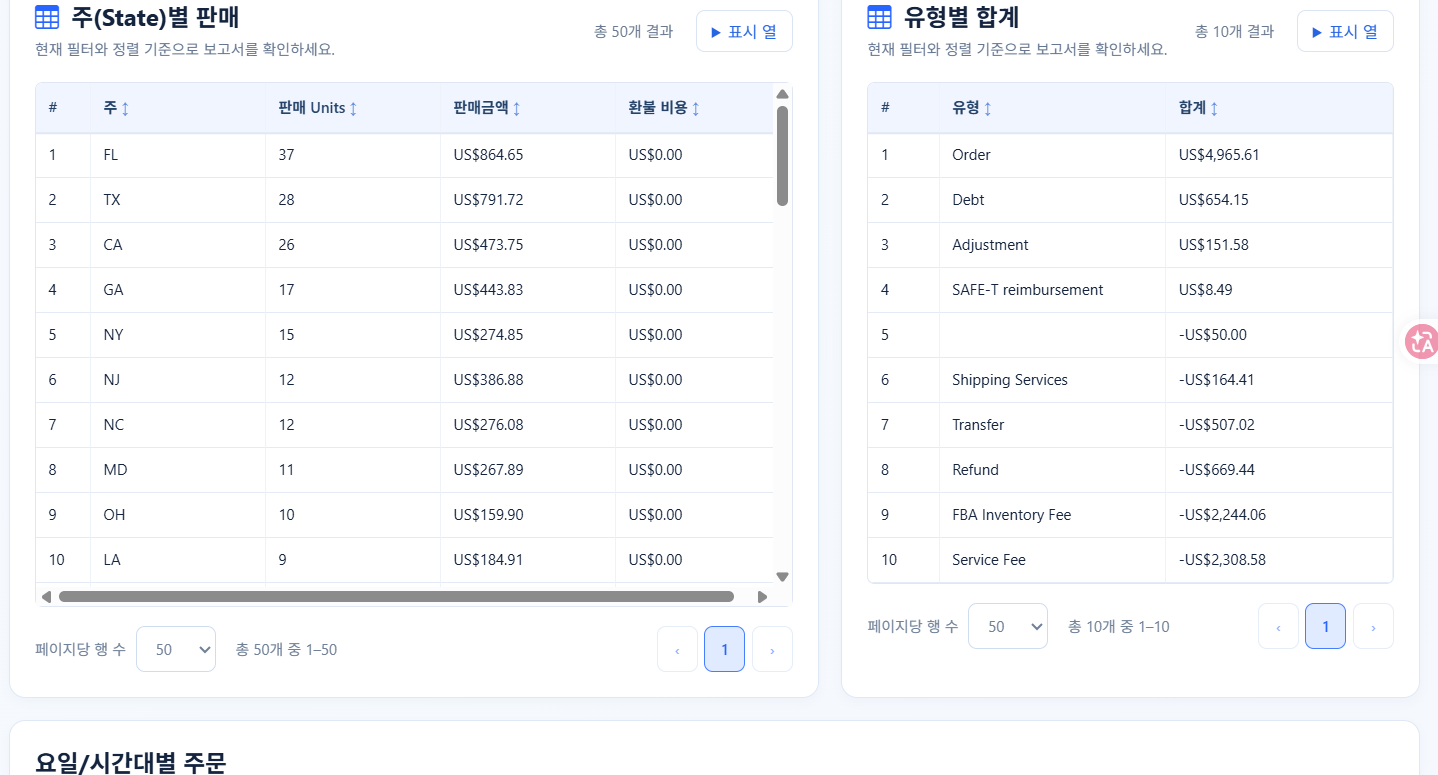
The proportion of advertising costs to sales exceeded 27%, and storage fees exceeded $2,100. This means the reason there was nothing left was not the fee rate, but advertising costs and inventory turnover. In the 'Sum by Type' table, if you look at the amounts in descending order, you can immediately see where to reduce costs.
Step 5. View profit by SKU
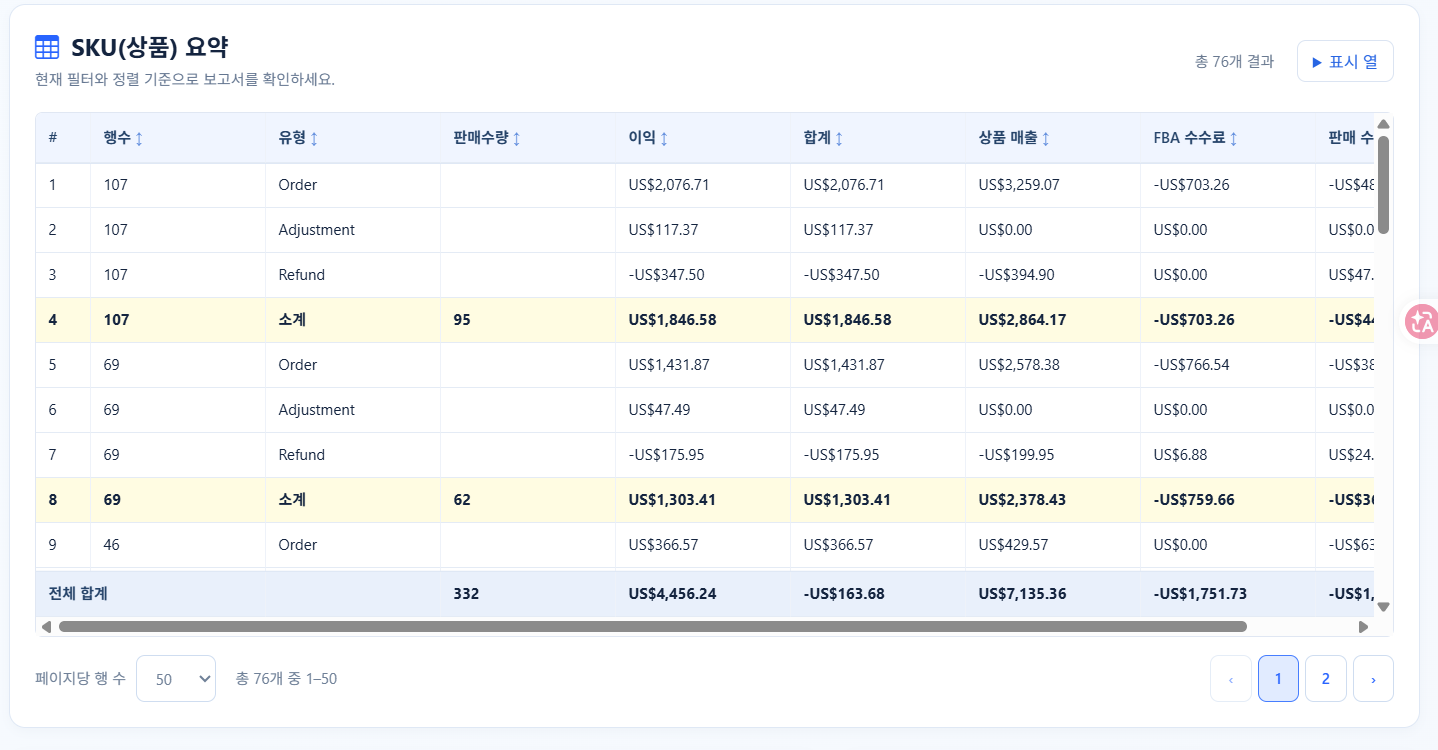
The SKU (Product) Summary table shows the number of rows, sales quantity, profit, total, product sales, FBA fees, and sales fees for each SKU. If you enter the cost price per SKU, the profit reflecting the product cost, shipping cost, and advertising cost is calculated. This distinguishes between SKUs that sell well but don't make a profit, and SKUs that have small sales but do make a profit.
Step 6. View sales by State
The sales by state table shows where products are sold. In the example, it was FL 37 units, TX 28 units, and CA 26 units, in that order. If sales are concentrated in a particular state, it provides a basis for reviewing inventory placement or shipping options in that region.
Step 7. Orders by Day and Time
The 'Orders by Day and Time' table shows when orders come in, in a grid format. In the example, there were 69 orders on Monday, 51 on Tuesday, 47 on Wednesday, 46 on Thursday, 35 on Friday, 41 on Saturday, and 32 on Sunday. This is used to adjust advertising budgets by time of day or to predict when inventory will deplete.
Step 8. Confirm evidence with detailed rows
Detailed rows contain transaction-level records. The example file has 439 entries, and the number of rows per page can be changed from 10 to 500. By keeping only the necessary items in the display columns, you can track the flow of refunds, storage fees, and advertising costs for a specific SKU at the transaction level.
Good order to follow when viewing settlement reports
- First, look at the final settlement amount and net profit margin in the summary.
- Identify large expenses first in the 'Sum by Type'. Most issues are resolved by looking at advertising costs, storage fees, and refunds in order.
- Find SKUs with negative profit in the SKU summary.
- Open the detailed rows for that SKU to identify any recurring expenses.
- Compare with the next period's report to check for improvements.
Frequently Asked Questions
- What file should I upload? It's the Transaction report from Payments. It's a CSV containing the settlement ID and period-specific transactions.
- Where are advertising costs? They are included in the 'Cost of Advertising' item for rows with 'Service Fee' as the type. The total may differ from the advertising console report, so refer to the settlement standard.
- Where do I enter the cost per SKU? If you enter the product cost, shipping cost, and advertising cost in the 'SKU Cost' item on the Payment Dashboard, it will be reflected in the profit calculation.
- Why do the settlement period and sales period differ? Settlement reports are based on cash flow. The order placement time and settlement time may differ, causing discrepancies with sales report amounts.
- How do I view refunds? Set the type filter to 'Refund' and check the SKU and reason. SKUs with repeated refunds may require detail page or quality checks.
Tips for Use
- View settlement reports at least quarterly. Looking at only one month can lead to misunderstandings about months with concentrated advertising and storage costs.
- If advertising costs exceed 20% of sales, first review your advertising structure.
- SKUs with increasing storage fees are slow-moving items. Consider order quantity and season together.
- Once you enter the cost per SKU, profits will be automatically calculated for subsequent reports.
- By combining keyword analysis and SQP reports, you can simultaneously identify where advertising costs are wasted and keywords with insufficient exposure.