Payment Dashboard
See true net profit for every SKU, payout, and time period
Turn Amazon settlement files into a clean, interactive dashboard that shows real profit after product cost, shipping, ads, and refunds.
Start with a detailed table where you can filter by date, SKU, marketplace, and fulfillment type, then add your own cost inputs per SKU.
On top, use summary cards, state-level breakdowns, and an order heatmap by weekday and hour to understand exactly when and where you make money.
What the Payment Dashboard helps you do
- Review a detailed table with filters and per-SKU cost inputs (product, shipping, ads)
- See summarized sales, fees, costs, refunds, and net profit
- Analyze sales and profit by state or region
- Use a weekday & hour order heatmap to find your strongest time slots
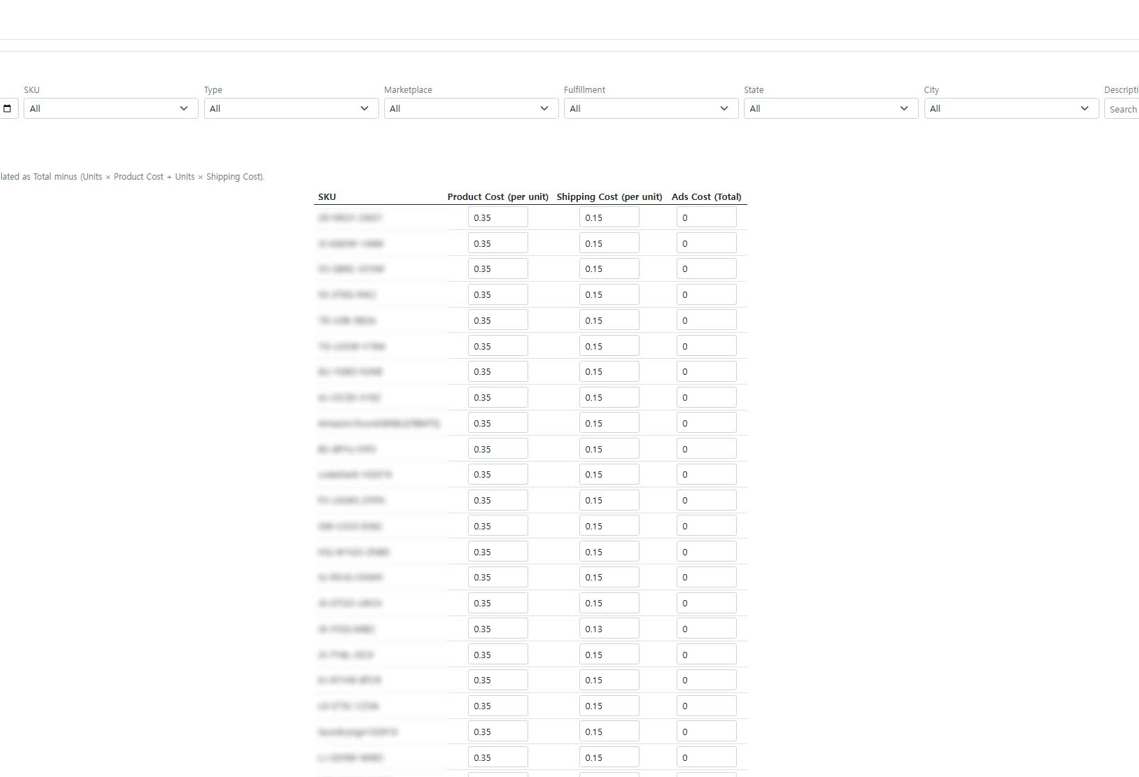
Net profit at the SKU level
Filter the table and enter product, shipping, and ads cost per SKU
- Use the main payment table to slice everything by date range, SKU, marketplace, fulfillment type, or order type so you can zoom into exactly the period you care about.
- For each SKU, enter or adjust product cost, shipping cost, and ads cost per unit; the dashboard then recalculates net profit and margin across all matching rows.
- Switch between views (by order, by SKU, by time) to understand which products are truly profitable once all real-world costs are included.
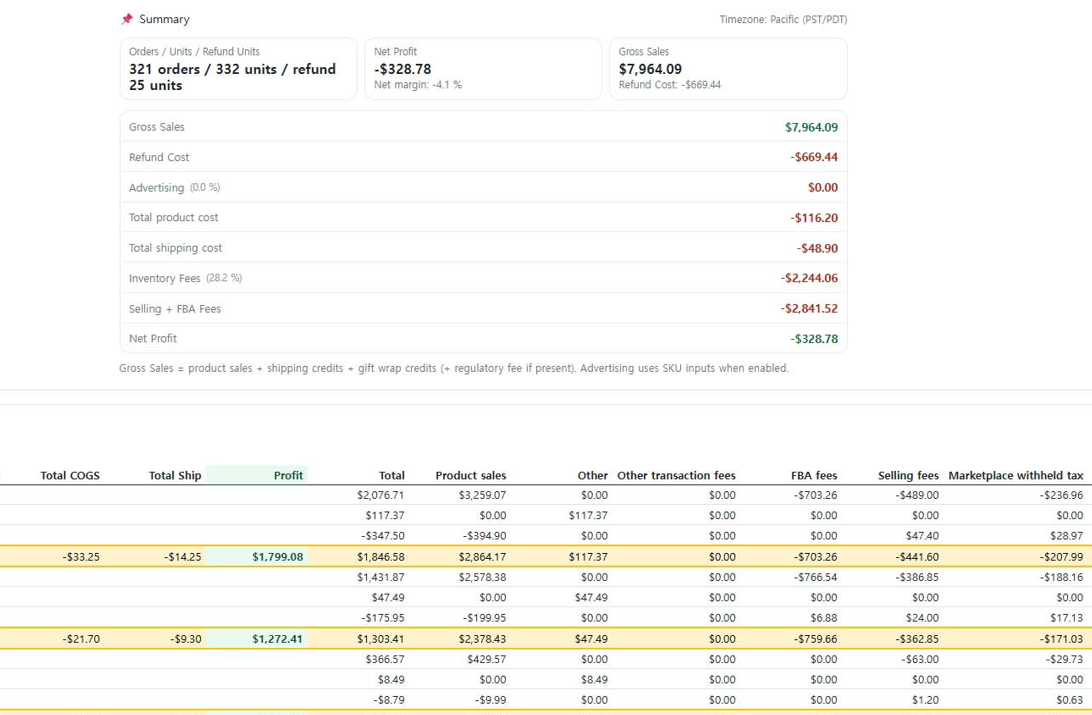
Full payout summary in one place
See total sales, fees, refunds, and net profit in clear summary cards
- Above the table, view clean summary tiles for gross sales, refunds, Amazon fees, product cost, shipping cost, ads cost, and final net payout.
- Each number responds to your filters, so changing the date range, marketplace, or SKU instantly updates both the table and the summary.
- Use these summaries to answer questions like “How much did I really make this month?” or “Which SKUs are driving most of my refunds and fees?”.
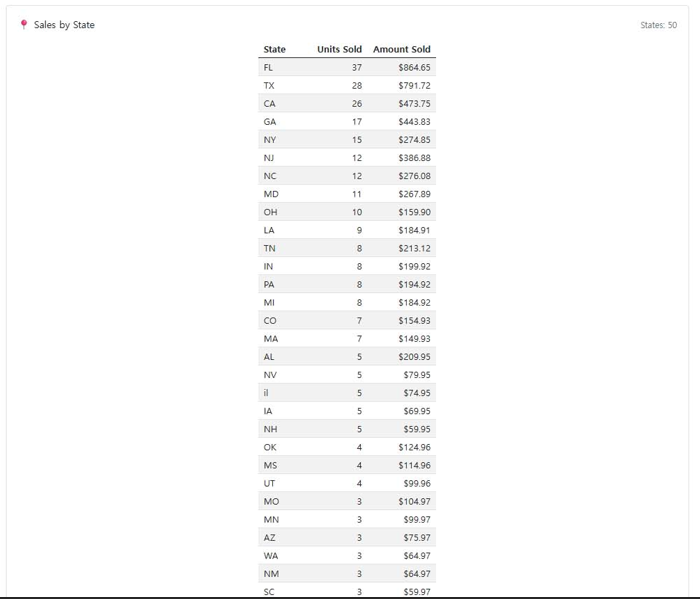
Sales by state or region
Understand where your customers are and where profit actually comes from
- Use the state-level view to see units, sales, and net profit broken down by state or region, based on the same filtered date range and SKU selection.
- Quickly spot high-volume but low-margin states, or regions where shipping cost or returns eat most of your profit.
- Combine this with your logistics and marketing strategy to decide where to focus inventory, pricing tests, or localized campaigns.
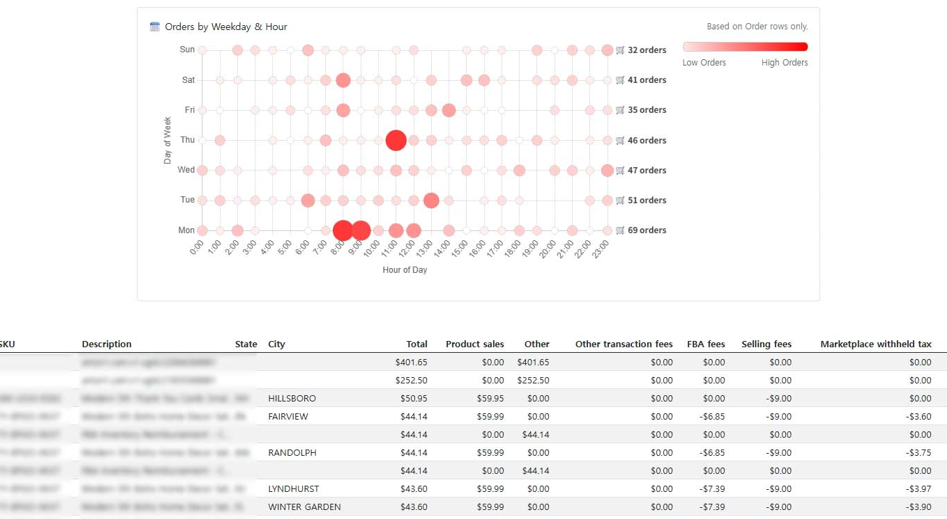
Order heatmap by weekday & hour
See when customers actually buy with a weekday and hour heatmap
- The order heatmap shows how many orders and how much revenue you receive for each combination of weekday and hour of day.
- Use it to find your strongest time slots, identify slow periods, and better align campaign budgets, lightning deals, and price tests.
- Filter by SKU or marketplace to see how buying patterns change between products or regions, instead of relying on guesswork.