Hello. Thank you to all customers who use SellerVisor.
When looking at competitor products, the first question is "How much will this product sell?" The next is "So what should I do with my product?" Neither question can be answered with a single number. You need to look at sales volume, price, rank, and keywords together for two products in the same category to compare them.
In this article, we compared two actual Amazon products using SellerVisor Market Research's two-product comparison feature and summarized the insights that can be drawn from the results.
Products Used for Comparison
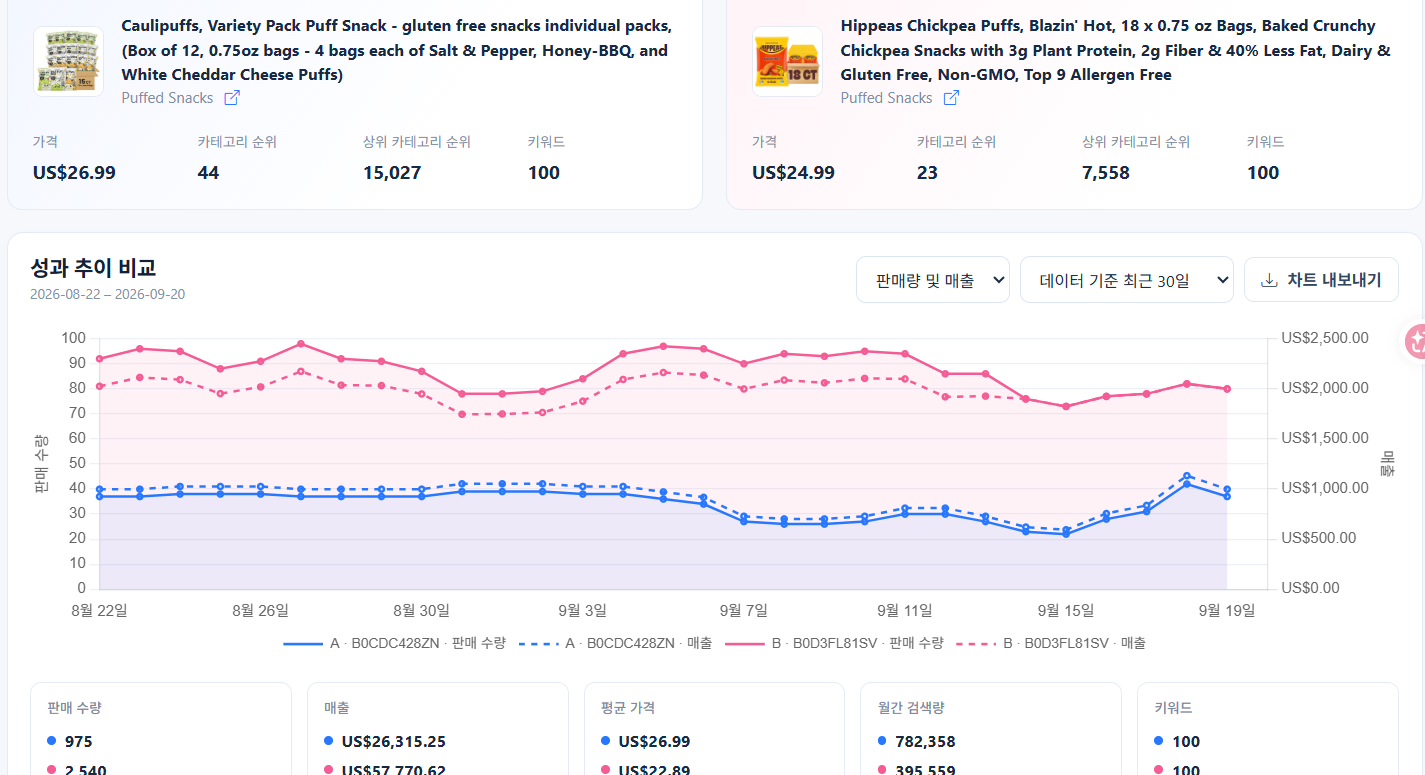
- A · B0CDC428ZN — Caulipuffs Variety Pack (0.75oz × 12 bags, White Cheddar·Salt & Pepper·Honey BBQ mix)
- B · B0D3FL81SV — Hippeas Chickpea Puffs Blazin' Hot (0.75oz × 18 bags)
Both are in the Puffed Snacks category within Grocery & Gourmet Food, and their format as individually packaged snacks is the same, making them suitable for comparison.
Step 1. Select 'Two-Product Comparison' in Market Research
Open Market Research from the left menu and select 'Two-Product Comparison' in the search area. While a single search shows only one product, a two-product comparison allows you to view trends and keywords side-by-side.
Step 2. Enter ASINs for A and B
The key is to enter products in the same category and similar price range. Comparing numbers from different categories will not be meaningful. You can also search by keywords, but it's better to enter ASINs for an accurate comparison of the exact same products.

Step 3. Check Basic Information on the Product Card
When the comparison begins, the images, product names, categories, current prices, category ranks, and number of connected keywords for both products are displayed side-by-side. At this stage, "What is the price, and what is the category rank?" immediately catches the eye.
Step 4. Compare Last 30-Day Performance Metrics
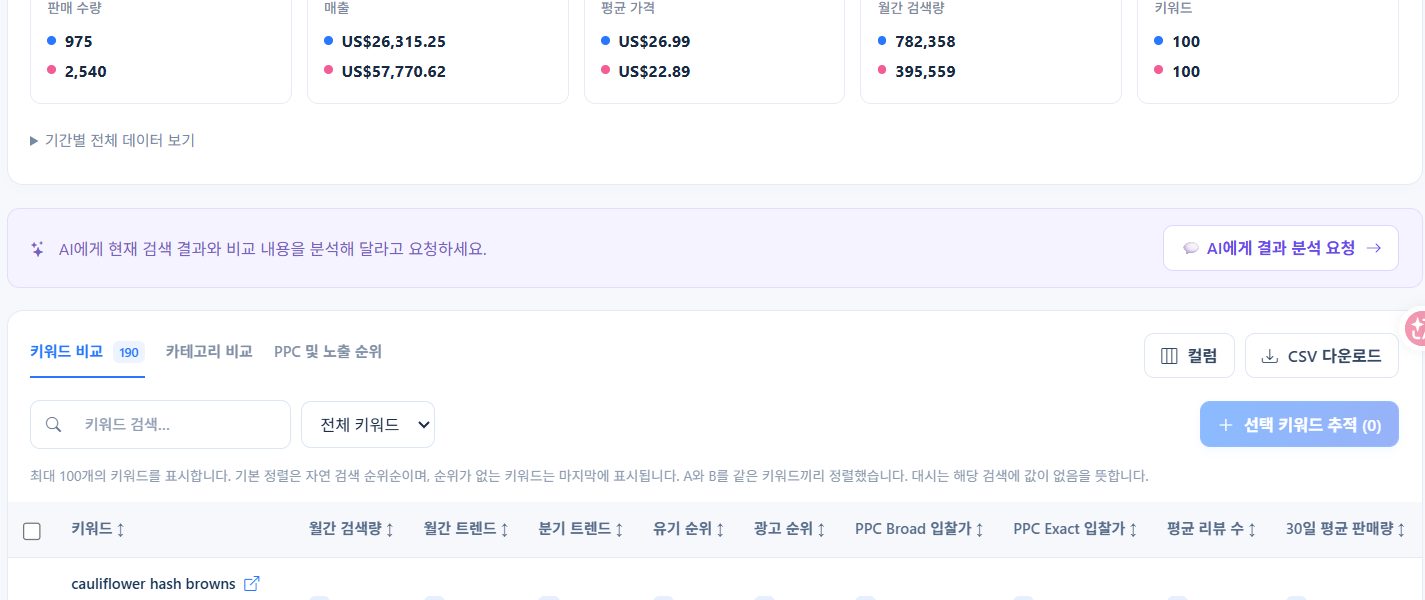
These are the 30-day metrics from this comparison result.
- Sales Volume — A 975 units / B 2,540 units
- Revenue — A US$26,315.25 / B US$57,770.62
- Average Price — A US$26.99 / B US$22.89
- Monthly Search Volume (Total Connected Keywords) — A 782,358 / B 395,559
- Connected Keywords — A 100 / B 100
The period can be changed to the last 7 days, 30 days, 90 days, 180 days, or 365 days. To see if it's a short-term event or seasonal, it's better to view it with 90 days or more.
Step 5. View Trends with Trend Charts
You can overlap sales volume and revenue, price, and rank on separate graphs. You can check when the current difference began and if there are periods where only one side surged. Charts can be exported as images.
Step 6. Keyword Comparison — 190 Side-by-Side
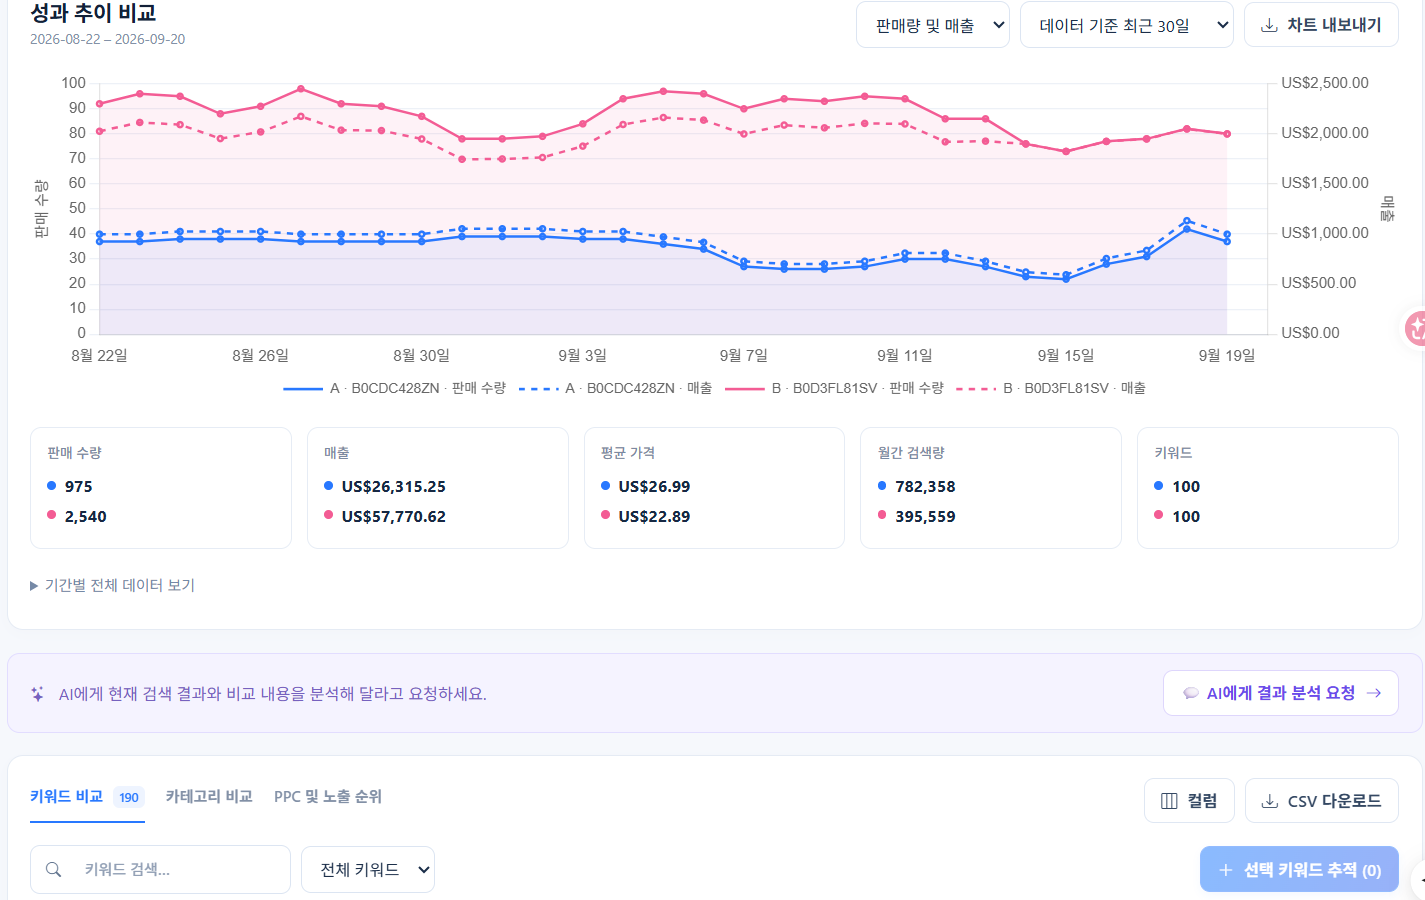
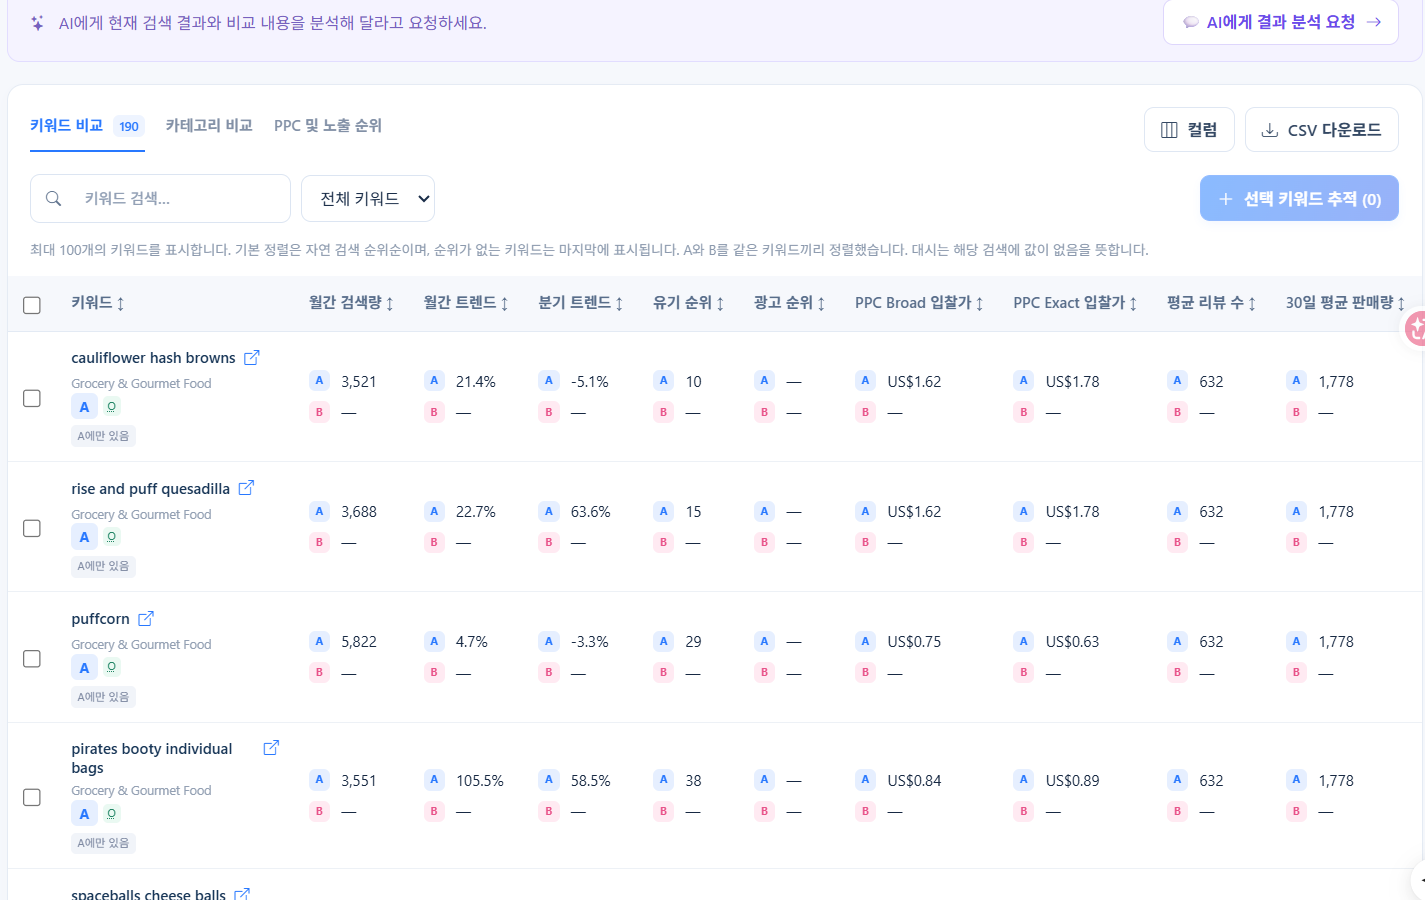
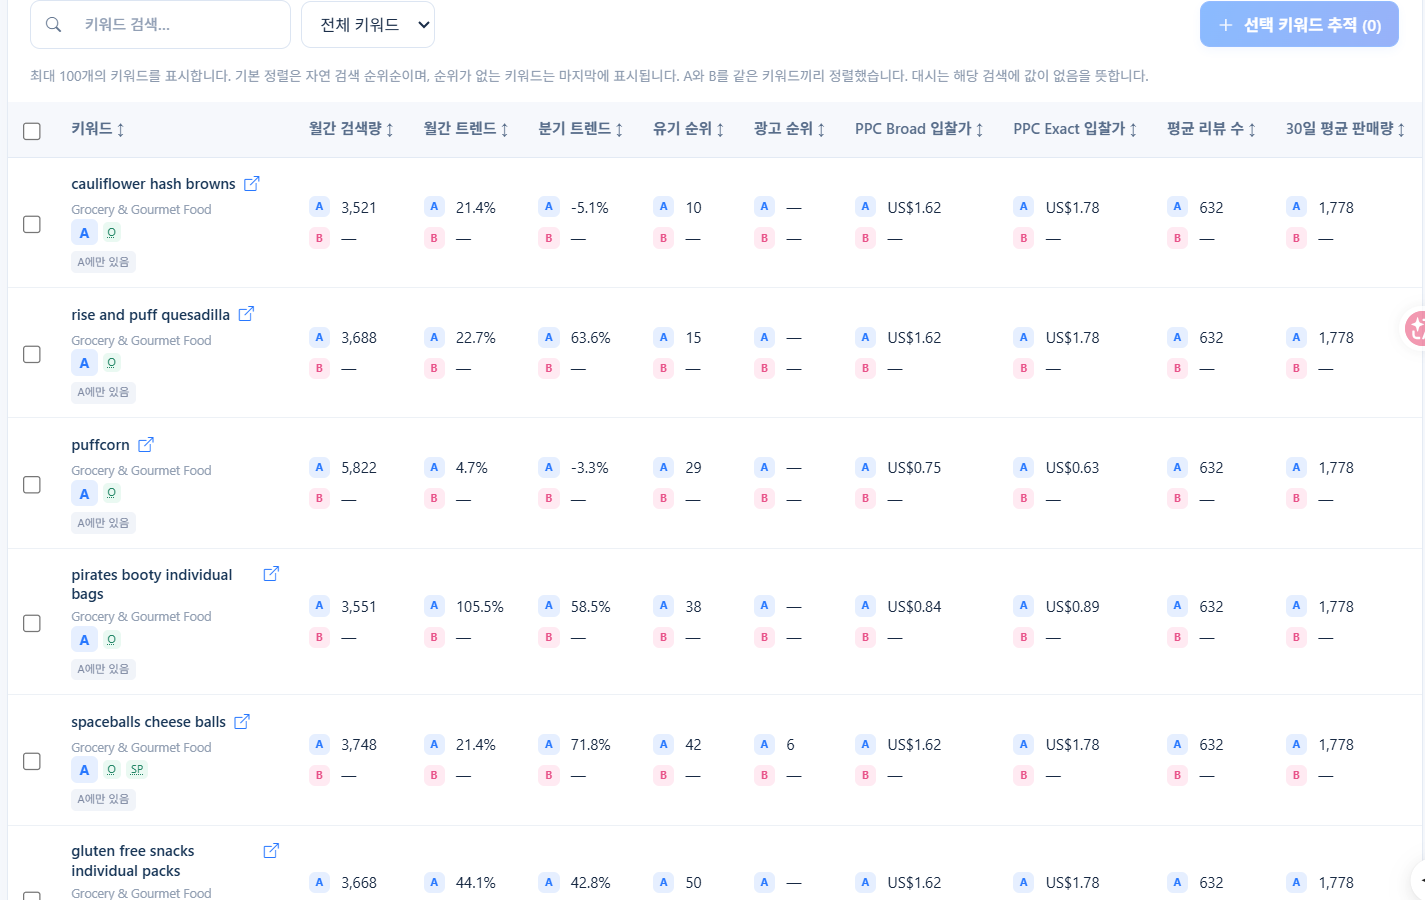
In this comparison, a total of 190 keywords were captured for the two products. You can view them separated by tabs: All Keywords / Common to A and B / Only in A / Only in B. The table also shows search volume, trend, organic rank, ad rank, PPC Broad/Exact bid price, average review count, and 30-day average sales volume/revenue all on one line.
Step 7. Four Insights Gained Here
1) The sales volume difference stemmed not from price, but from 'price per unit volume'. Product B has 2.6 times the sales volume and 2.2 times the revenue, yet its average price is 15% lower than A. Based on individual 0.75oz packets, A offers 12 bags (total 9oz) for US$26.99, approximately US$3.00 per ounce, while B offers 18 bags (total 13.5oz) for US$22.89, approximately US$1.70 per ounce. The unit price perceived by consumers differs by nearly twofold.
2) If search volume is high but sales are low, you should suspect conversion issues. The total monthly search volume for keywords connected to A is 780,000, twice that of B (395,000). While A has broader traffic touchpoints, its sales are 2.6 times lower. When this combination appears, it's a point to sequentially check the main image, price/bundle configuration, number of reviews and ratings, and the first screen of the detailed product page.
3) Category rank indicates market position. B is ranked 23rd in its category (7,558th in the broader category), while A is 44th (15,027th). Checking if the sales difference and rank difference of the two products are moving in the same direction makes it easier to determine if a product is on an upward trend or stagnating.
4) Keywords present only on one side indicate the next action. Keywords captured only for A include search terms for alternative snacks/competitor brands like puffcorn, cauliflower hash browns, pirates booty individual bags, and spaceballs cheese balls. This means A is absorbing demand from those "looking for other snacks," and these keywords become candidates for your product's advertising and listing keywords. Conversely, keywords present only for B are areas that B has preempted, so you need to decide whether to enter them.
For reference, the sales volume and revenue in Market Research are estimates based on Amazon data. It is more accurate to use them for relative comparison between A and B, and to observe changes within the same period, rather than as absolute values.
Step 8. Export and Request AI Analysis
The keyword table can be downloaded as a CSV, and the entire comparison result can be exported as a report. By clicking 'Request AI Analysis' at the top of the results screen, you can receive a summary based on the current search and comparison results, which can reduce the time spent interpreting numbers.
Frequently Asked Questions
- Which products should I compare? Products in the same category and with similar packaging (individual packaging · set quantity) are easiest to interpret. If the price difference is more than twofold, comparison interpretation becomes difficult.
- What if rank and revenue move separately? Look at the 'Rank' tab and 'Revenue' tab together in the trend chart. If rank increases but revenue stagnates, you might suspect increased reliance on advertising.
- How do I use the Keyword tab? Common keywords are areas of clear competition, while keywords present only in A or only in B are currently vacant areas. When selecting candidates for advertising and listing keywords, you can view these two tabs separately.
- Can I compare with my own product? Yes. If you enter your product's ASIN for A and a competitor's product ASIN for B, they will be compared immediately using the same criteria.
Principles to Follow When Comparing
- Compare within the same marketplace (US·CA·JP·MX). If countries differ, the numbers cannot be directly interpreted.
- Don't just look at a 30-day period; also look at 90 days and 180 days.
- For keywords, look at search volume and 30-day average sales volume together, not just rank. Keywords with high rank but low search volume have little effect.
- Since estimates have rounding and sample differences, leave room to consider a 10-20% difference as a rank fluctuation.
Open Market Research: https://www.sellervisor.com/research