Hello. SellerVisor customers. Thank you for always using SellerVisor.
This Profit Dashboard update started with stories from actual sellers. The most frequent concerns heard during consultations and coaching were three-fold:
- It's difficult to tell if changing listing images and A+ content actually helped.
- Orders increased after lowering prices, but the remaining profit may have decreased instead.
- There's no record of when and what was changed, making it difficult to revert even if results are poor.
Before meticulously setting up ads, the first thing to look at is the purchase conversion rate. However, if there's no way to check the results after changing a listing, you might give up on the change itself or judge based on intuition. That's why SellerVisor created a feature that automatically records listing change history and compares conversion rates, sales, ad efficiency, and net profit before and after changes on one screen.
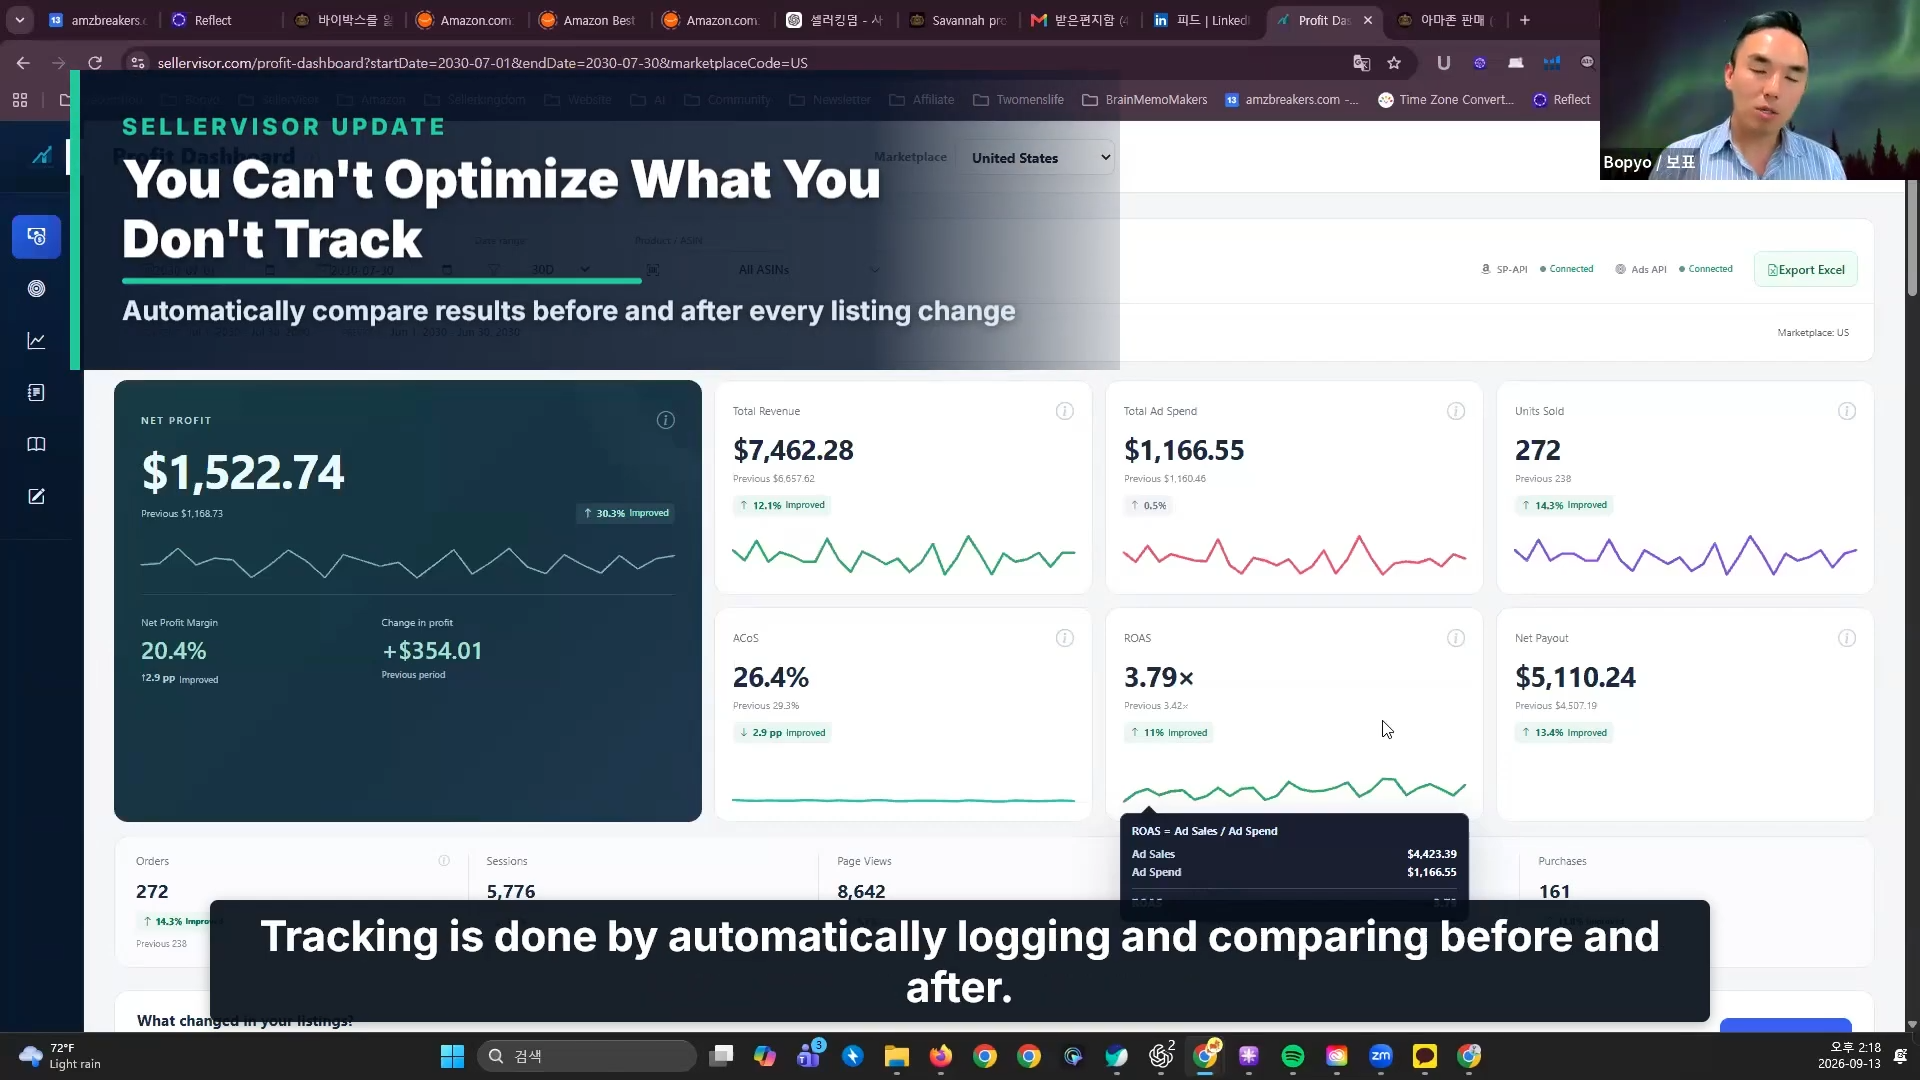
SellerVisor Update — “You Can’t Optimize What You Don’t Track”. Automatically compares results after changing listings.
Below, we will sequentially review with actual screens. The content has been organized based on the update video on SellerVisor's official YouTube channel (Amazon Conversion Rate Optimization: Track Every Listing Change with SellerVisor).
3 Key Points at a Glance
- If the selling price and cost per click are the same, a higher purchase conversion rate leads to more orders for the same advertising cost.
- If you've changed your listing, don't just look at the conversion rate; you should also check ad efficiency (ACOS·ROAS) and net profit.
- It is advantageous to build up change history and comparison benchmarks before Q4 traffic increases.
With the same 500 clicks, why do sales differ by 2.22 times?
Let's assume two sellers with the same 500 ad clicks, a selling price of $30, and a cost per click (CPC) of $0.81. The only difference is the purchase conversion rate. Seller A has 4.5%, Seller B has 10%, and the ad spend is the same for both sellers at $405.
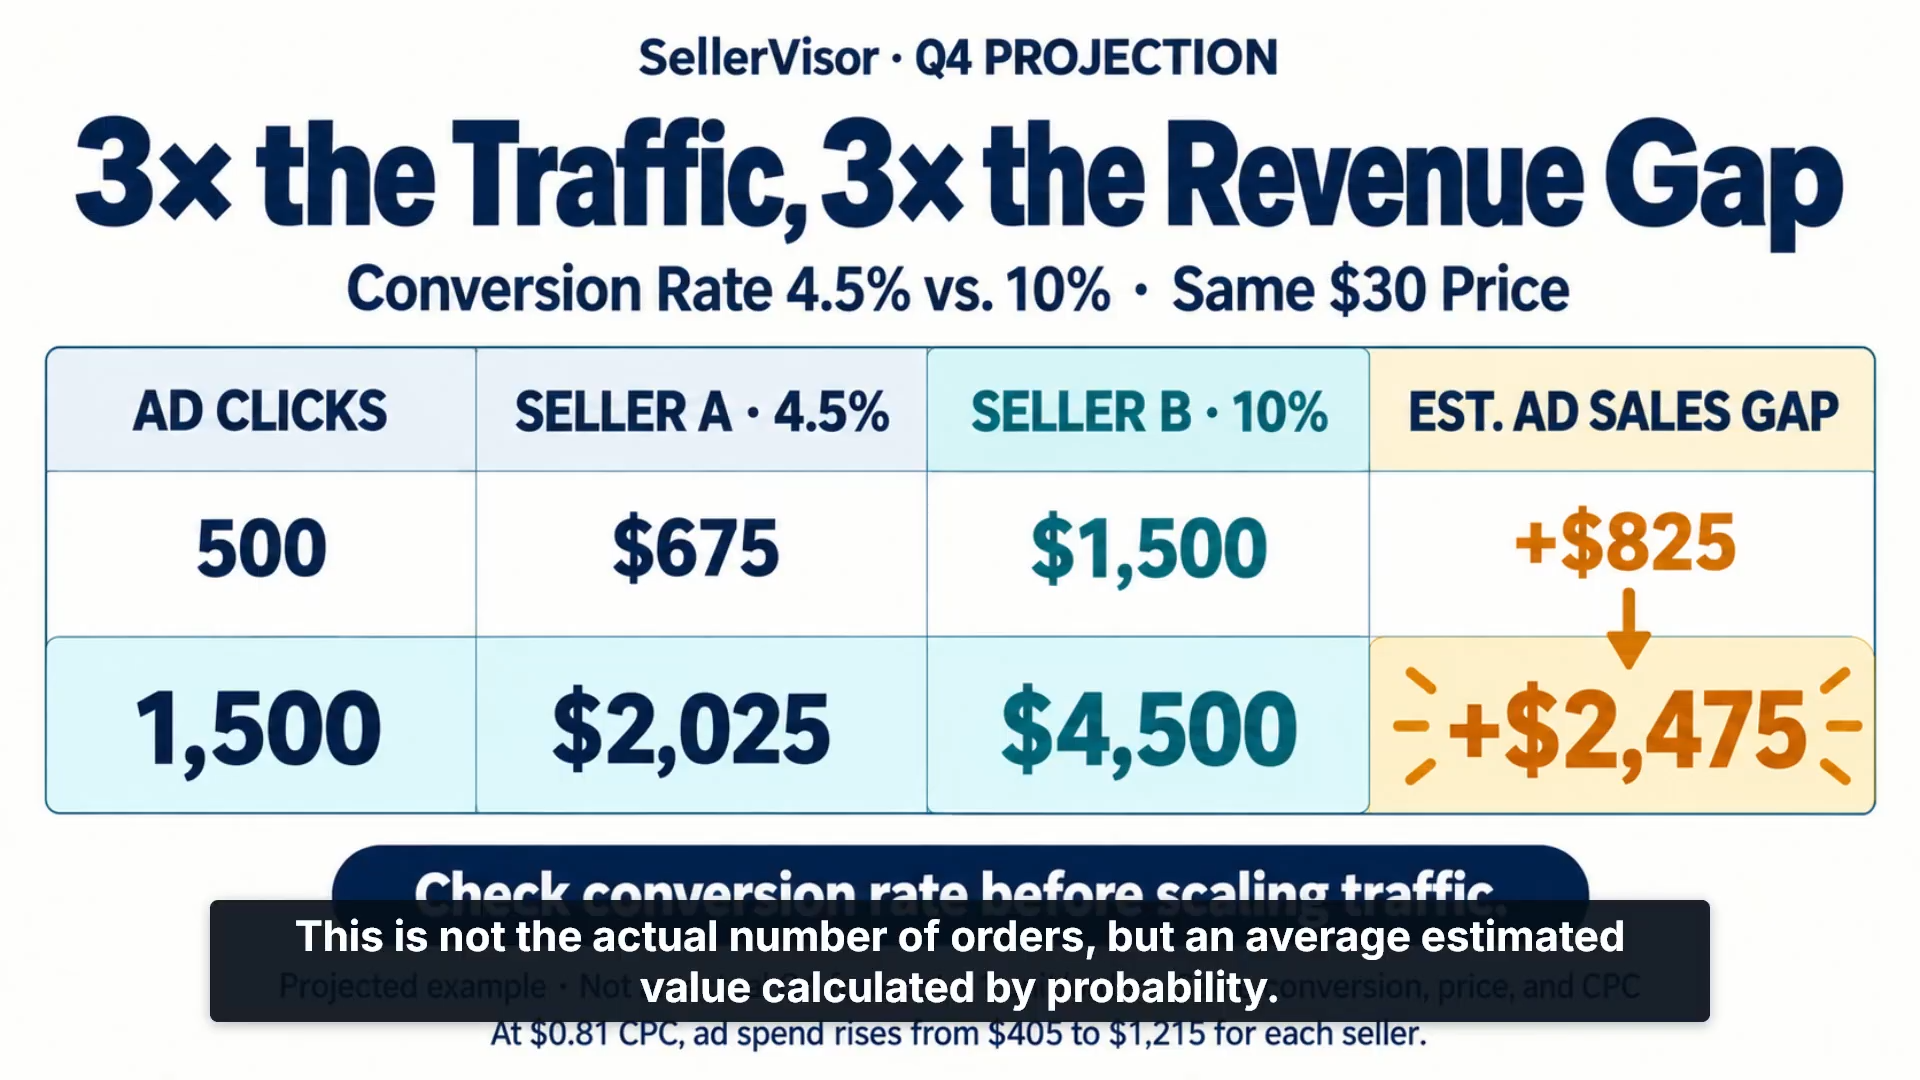
Same 500 clicks · Same $30 selling price · Same $405 ad spend. The difference in estimated ad revenue between a 4.5% and 10% purchase conversion rate is +$825.
- Estimated orders: Seller A 22.5 units / Seller B 50 units
- Estimated ad revenue: A $675 / B $1,500
- Ad spend per order: A $18.00 / B $8.10
- ACOS: A 60.0% / B 27.0%
- ROAS: A 1.67x / B 3.70x
Seller B's estimated ad revenue is approximately 2.22 times that of A, with a difference of $825. The conversion rate is 5.5 percentage points higher, and ACOS is 33 percentage points lower. The ad spend to acquire one order also decreases by 55%.
The calculation is simple. Ad spend is 500 × $0.81 = $405, estimated orders are clicks × purchase conversion rate, and estimated ad revenue is estimated orders × $30. Here, 22.5 units are not actual order records but expected values applying the conversion rate, and 500 ad clicks do not necessarily mean 500 different customers.
CVR·CTR·ACOS·ROAS, What should you look at?
- Purchase Conversion Rate (CVR): In this example, it's the percentage of ad clicks that led to an order. When viewing session-based conversion rates in an actual account, note that the denominator is different.
- Click-Through Rate (CTR): The number of clicks relative to the number of impressions. It's important to separate the stage of getting clicks from the stage of purchasing after a click.
- ACOS: Ad spend ÷ Ad revenue × 100. Seller B is $405 ÷ $1,500 × 100 = 27%.
- ROAS: Ad revenue ÷ Ad spend. Seller B is approximately 3.70x.
These metrics show advertising efficiency. They should be distinguished from the final net profit, which includes product cost and Amazon fees.
Key to this update: Automatically records listing change history
You've probably tried adjusting titles, changing main images, and modifying prices to increase conversion rates. The problem arises a few days later: it's not easy to remember "what was changed and when" when sales differ.
SellerVisor's What changed in your listings? section automatically records these actions. Title, bullet points, description, A+ content, image, and price changes are saved with the date, and selecting an item from the record leads to the Listing change impact screen.
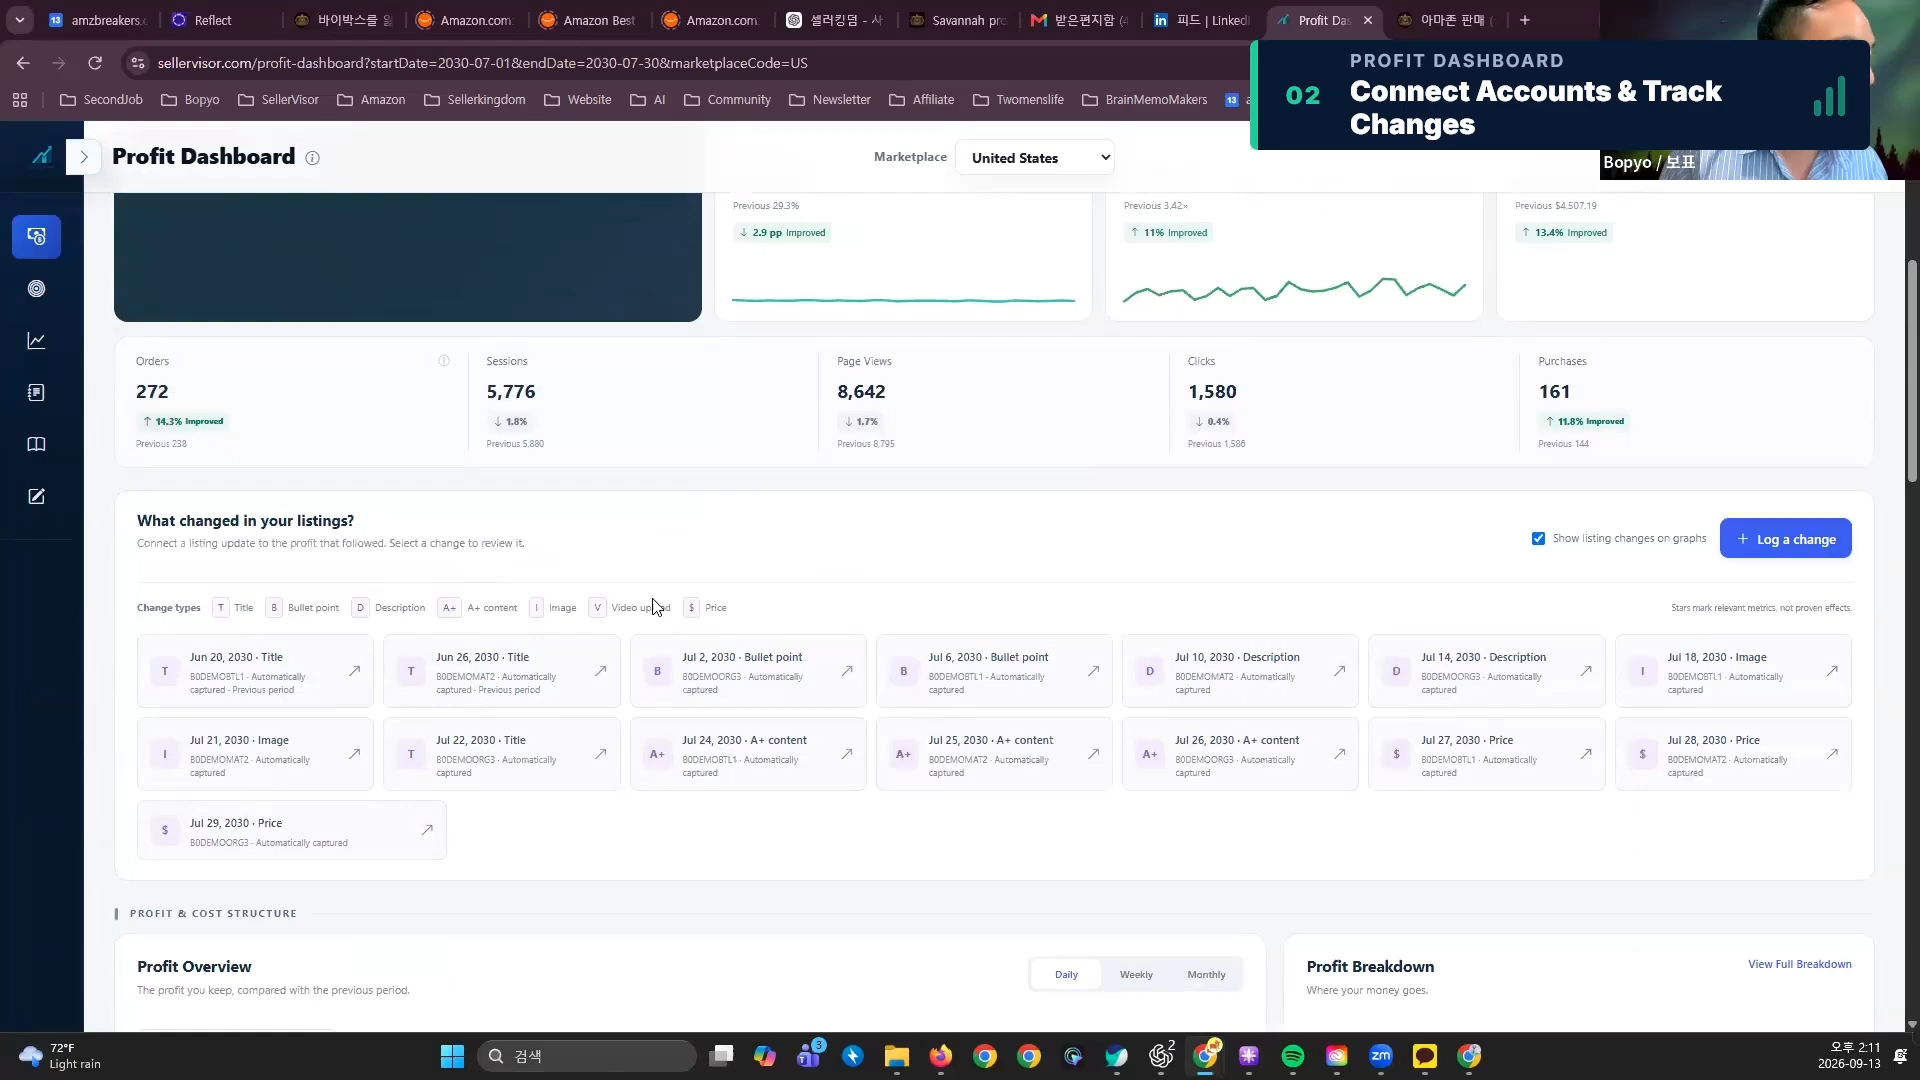
What changed in your listings? — Title, bullet points, description, image, price, and A+ content changes are automatically recorded by date.
Check performance before and after changes in this order
1. Check Amazon account connection and query range
In SellerVisor settings, check the connection status of your Amazon seller account's SP-API and Amazon Ads API. Then, select the marketplace and period to analyze on the dashboard. Once both connections are complete, net profit, total revenue, ad spend, ACOS, units sold, and net payout will be displayed as cards.
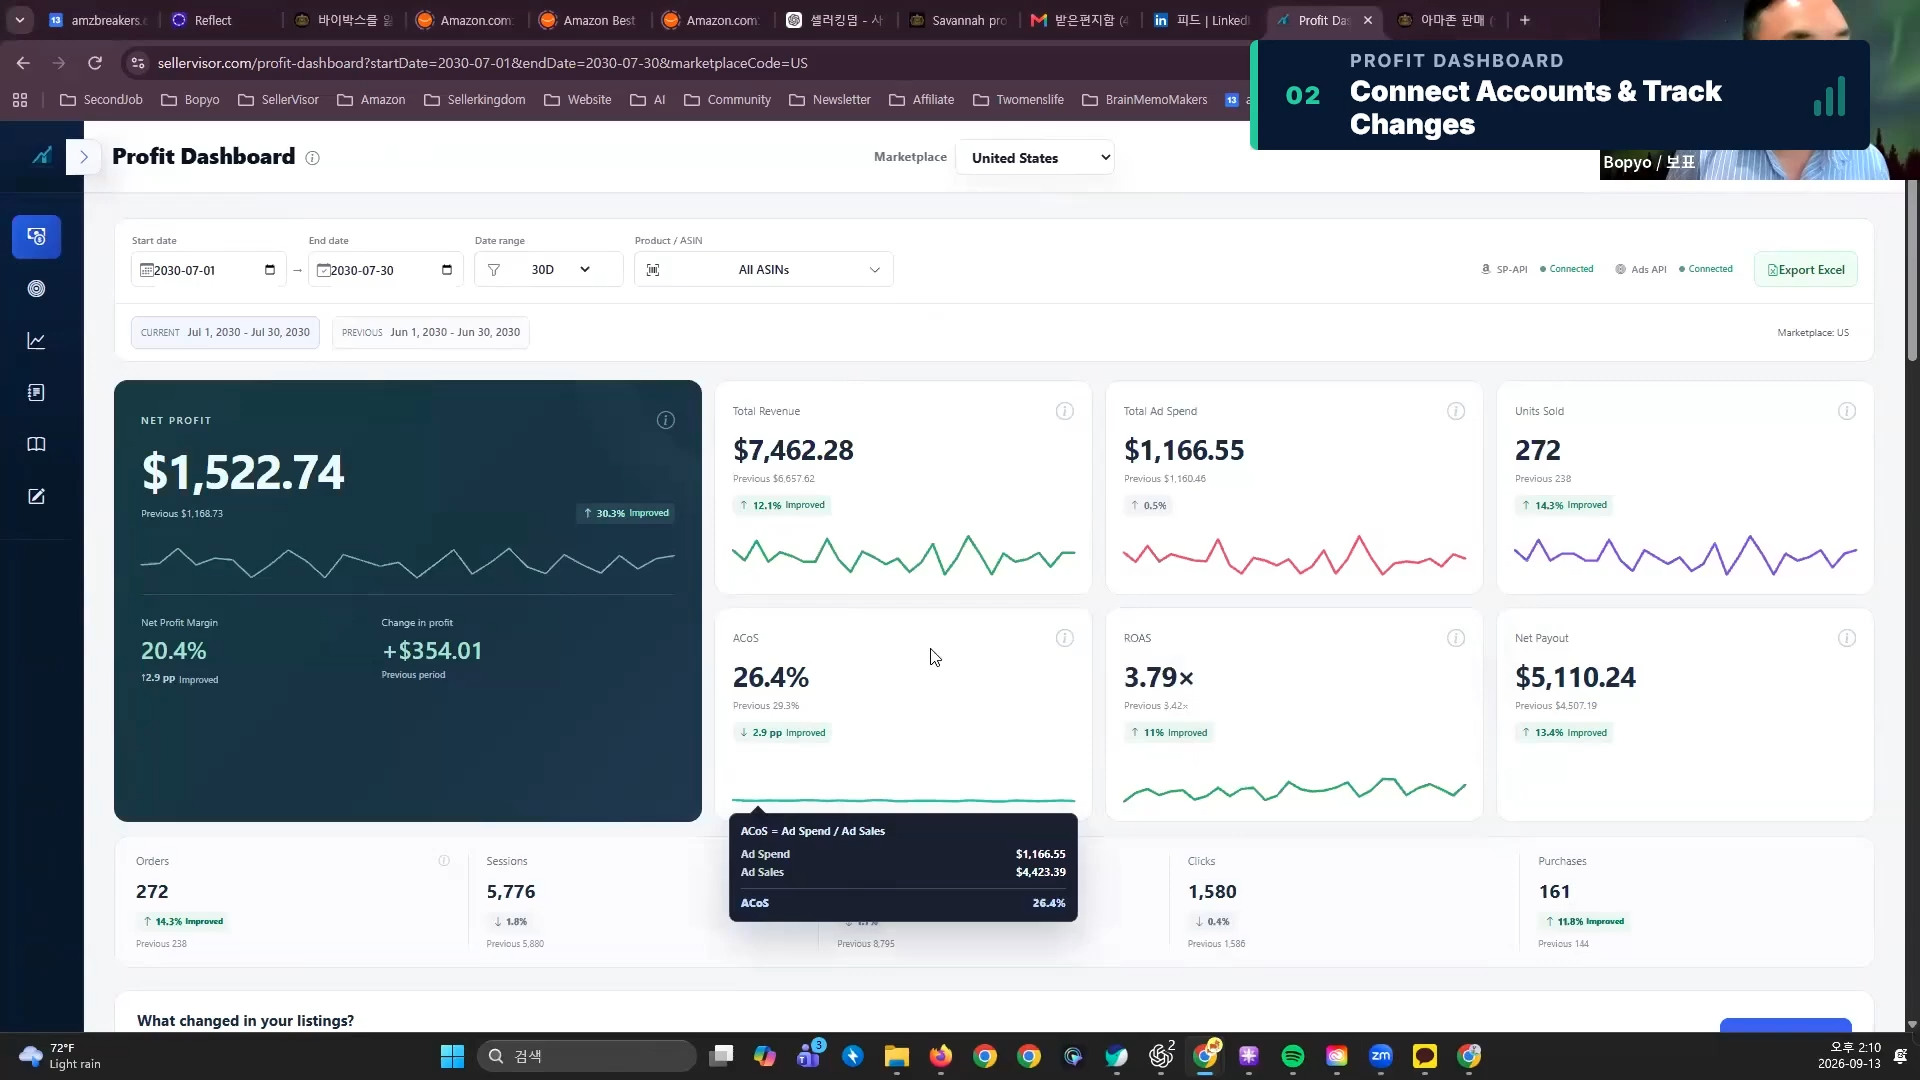
02 Connect Accounts & Track Changes — Connecting SP-API and Ads API displays a net profit of $1,522.74, revenue of $7,462.28, and ad spend of $1,166.55.
2. Select the change item and period for comparison
From the change history, select the product and item, then choose a comparison period from 7 days, 14 days, or 1 month. Before and After will be displayed side-by-side, and the day of the change is excluded from the comparison.
3. Read conversion rate and net profit together
In the A+ content change demo, net profit is displayed as $44.14 → $64.60, net profit margin as 24.5% → 26.9%, and revenue as $179.91 → $239.88. Below the screen, a daily trend graph before and after the change is also shown.
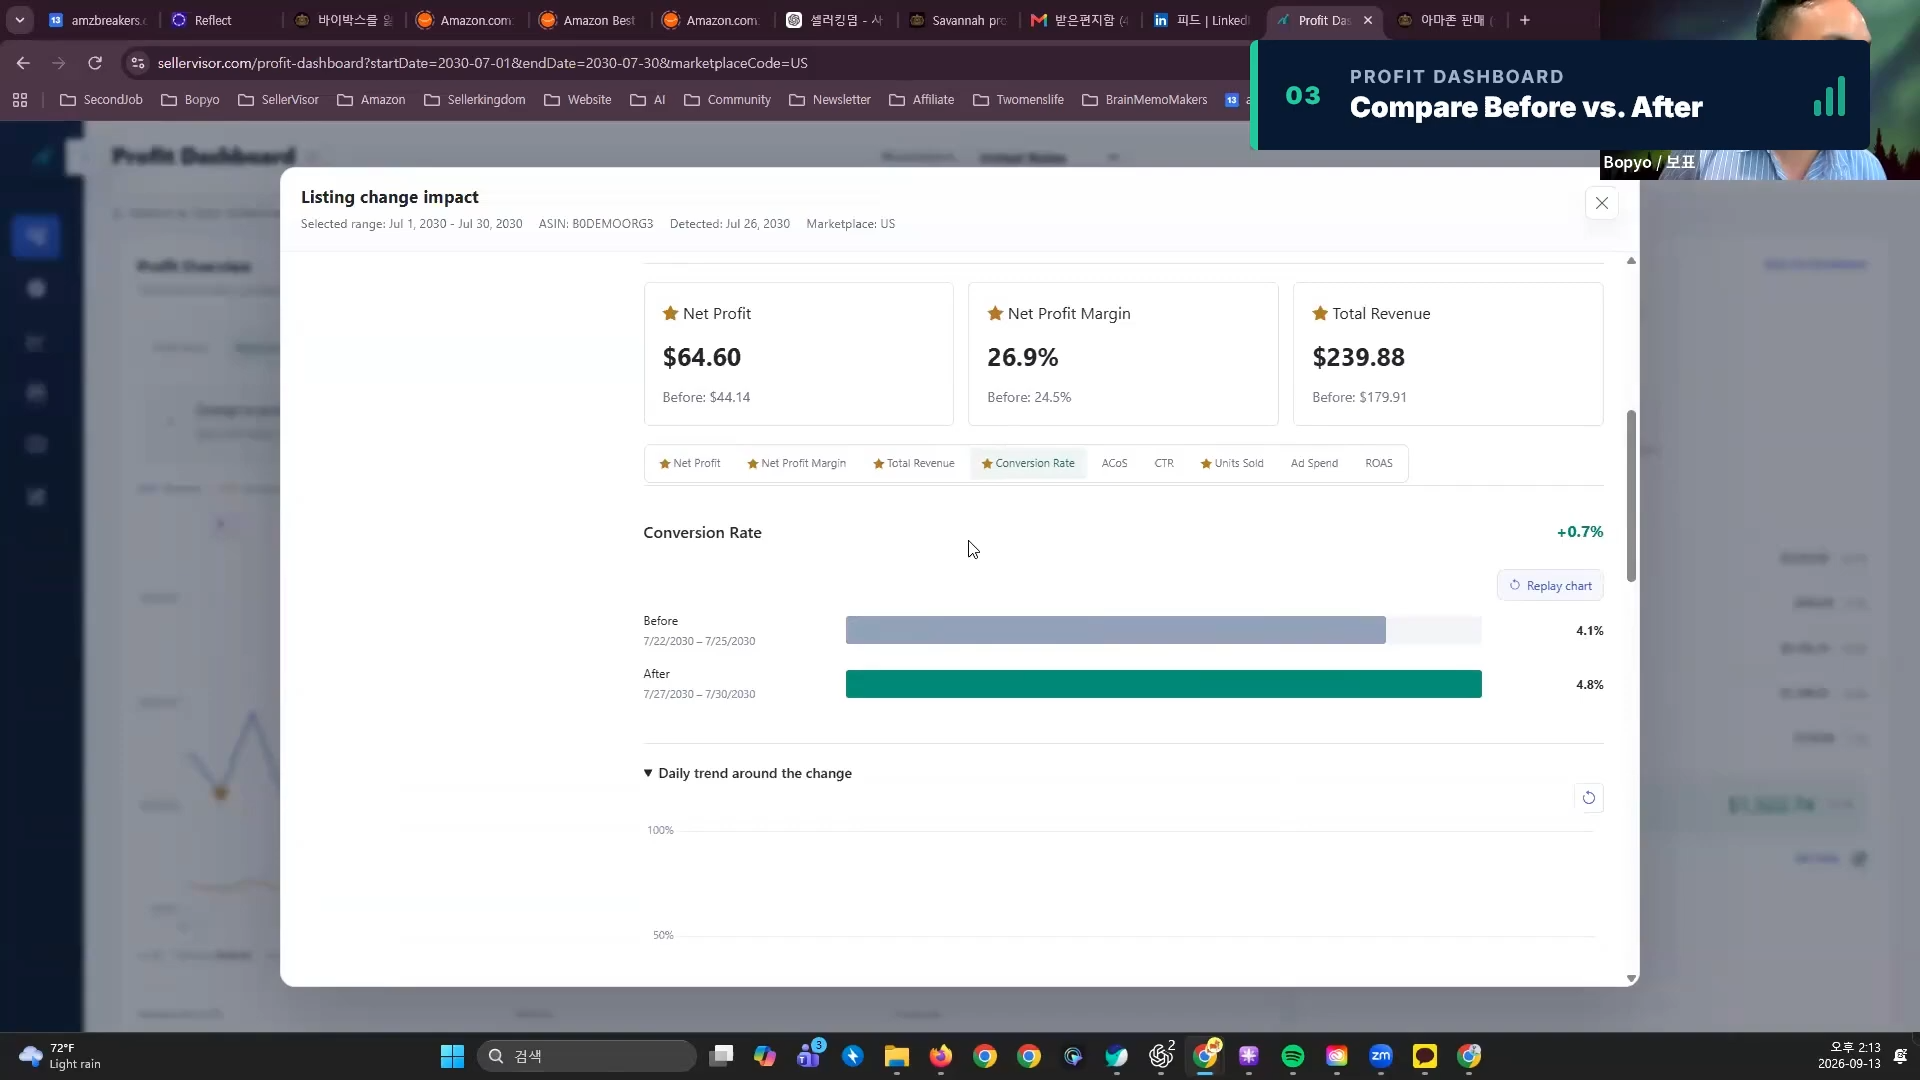
Listing change impact (A+ content change) — Net Profit $44.14 → $64.60, Net Profit Margin 24.5% → 26.9%, Revenue $179.91 → $239.88.
Asterisks indicate metrics highly relevant to the change. Since asterisks alone do not prove effectiveness, also check other factors that changed during the same period.
4. Decide whether to keep or revert
In the price change demo, before and after changes for a product with a selling price of $37.99 are compared. The screen displays a net profit of $47.95, a net profit margin of 17.1%, and revenue of $279.92, among others. Even if orders increase after lowering the price, the margin per order might decrease, so it's important to look at both revenue and net profit.
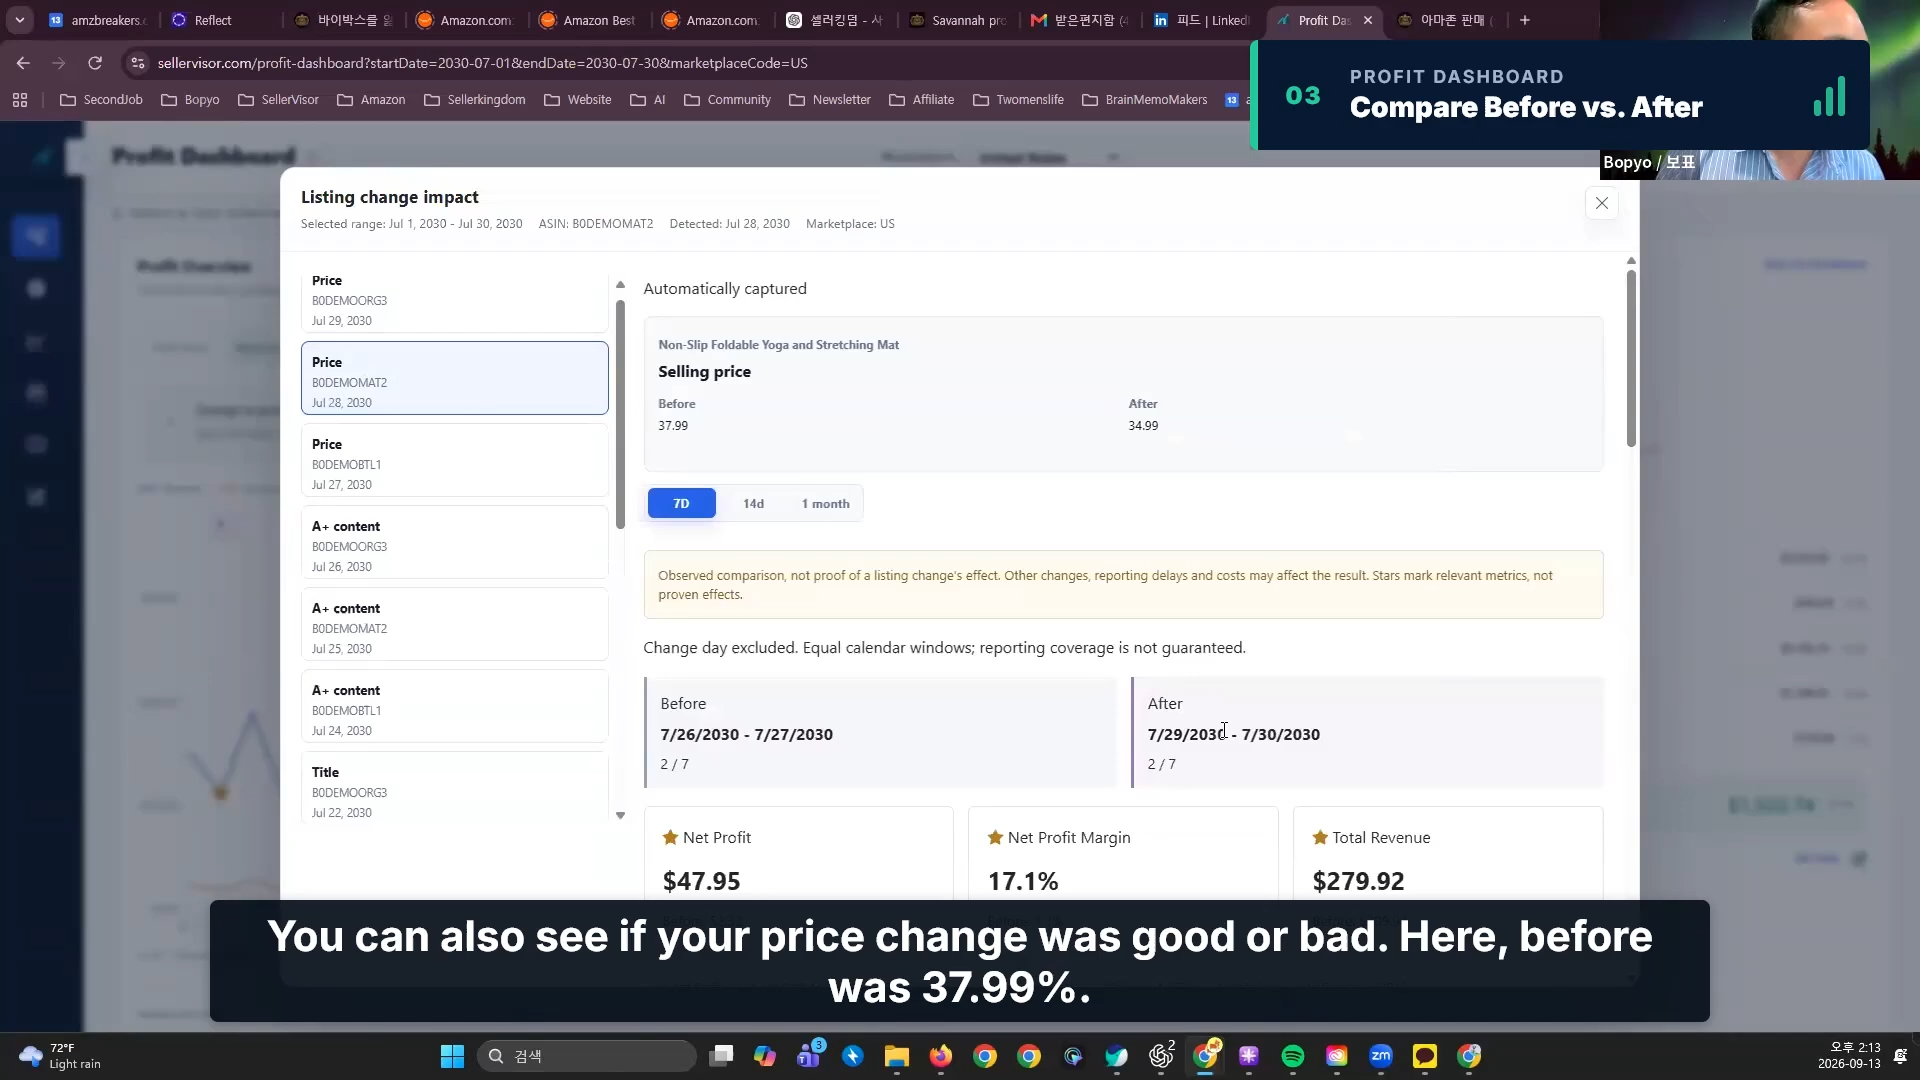
Listing change impact (Price change) — Based on selling price $37.99: Net Profit $47.95, Net Profit Margin 17.1%, Total Revenue $279.92.
If possible, change only one factor at a time and compare the before-and-after trends. Briefly noting the confirmed metrics and reasoning will serve as a benchmark when repeating the same experiment.
Metrics available for simultaneous review on the Profit Dashboard
On the dashboard's top cards, you can view Net Profit, Total Revenue, Total Ad Spend, Units Sold, ACOS, ROAS, and Net Payout all at once. Changes compared to the previous period are also displayed, making it easy to see how revenue increases are linked to ad spend increases.
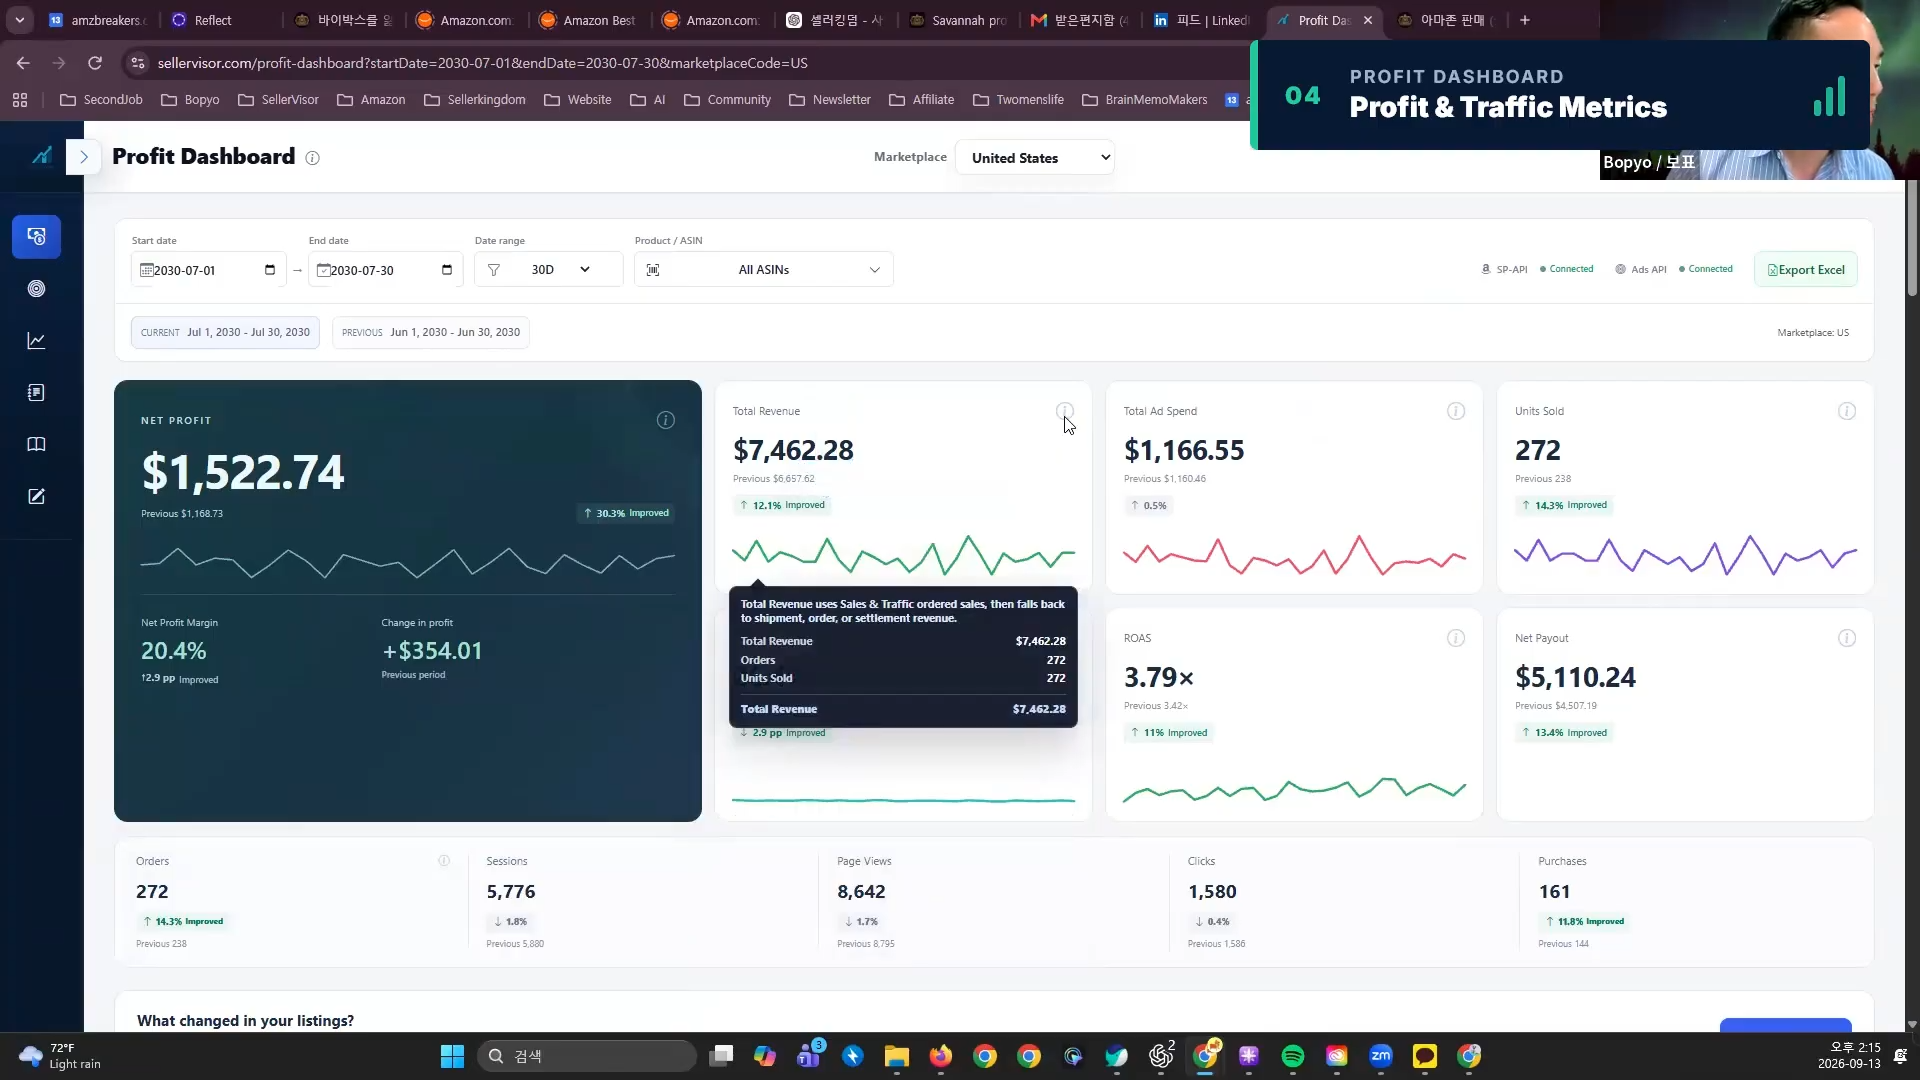
04 Profit & Traffic Metrics — Net Profit $1,522.74, Revenue $7,462.28, Ad Spend $1,166.55, ROAS 3.79x, Net Payout $5,110.24.
Metric Cards and Performance Trend
The Performance Trend compares the trend over time for sales, ad spend, ACOS, ROAS, units sold, and net profit. If you notice a sharp increase or decrease on a specific date, review it alongside the change history for that period.
Profit Overview·Profit Breakdown·Top Profit Drivers
Profit Overview shows daily, weekly, and monthly trends, while Profit Breakdown displays cost components such as product cost, shipping fees, Amazon fees, ad spend, and returns. Top Profit Drivers summarizes which products contribute to profit.
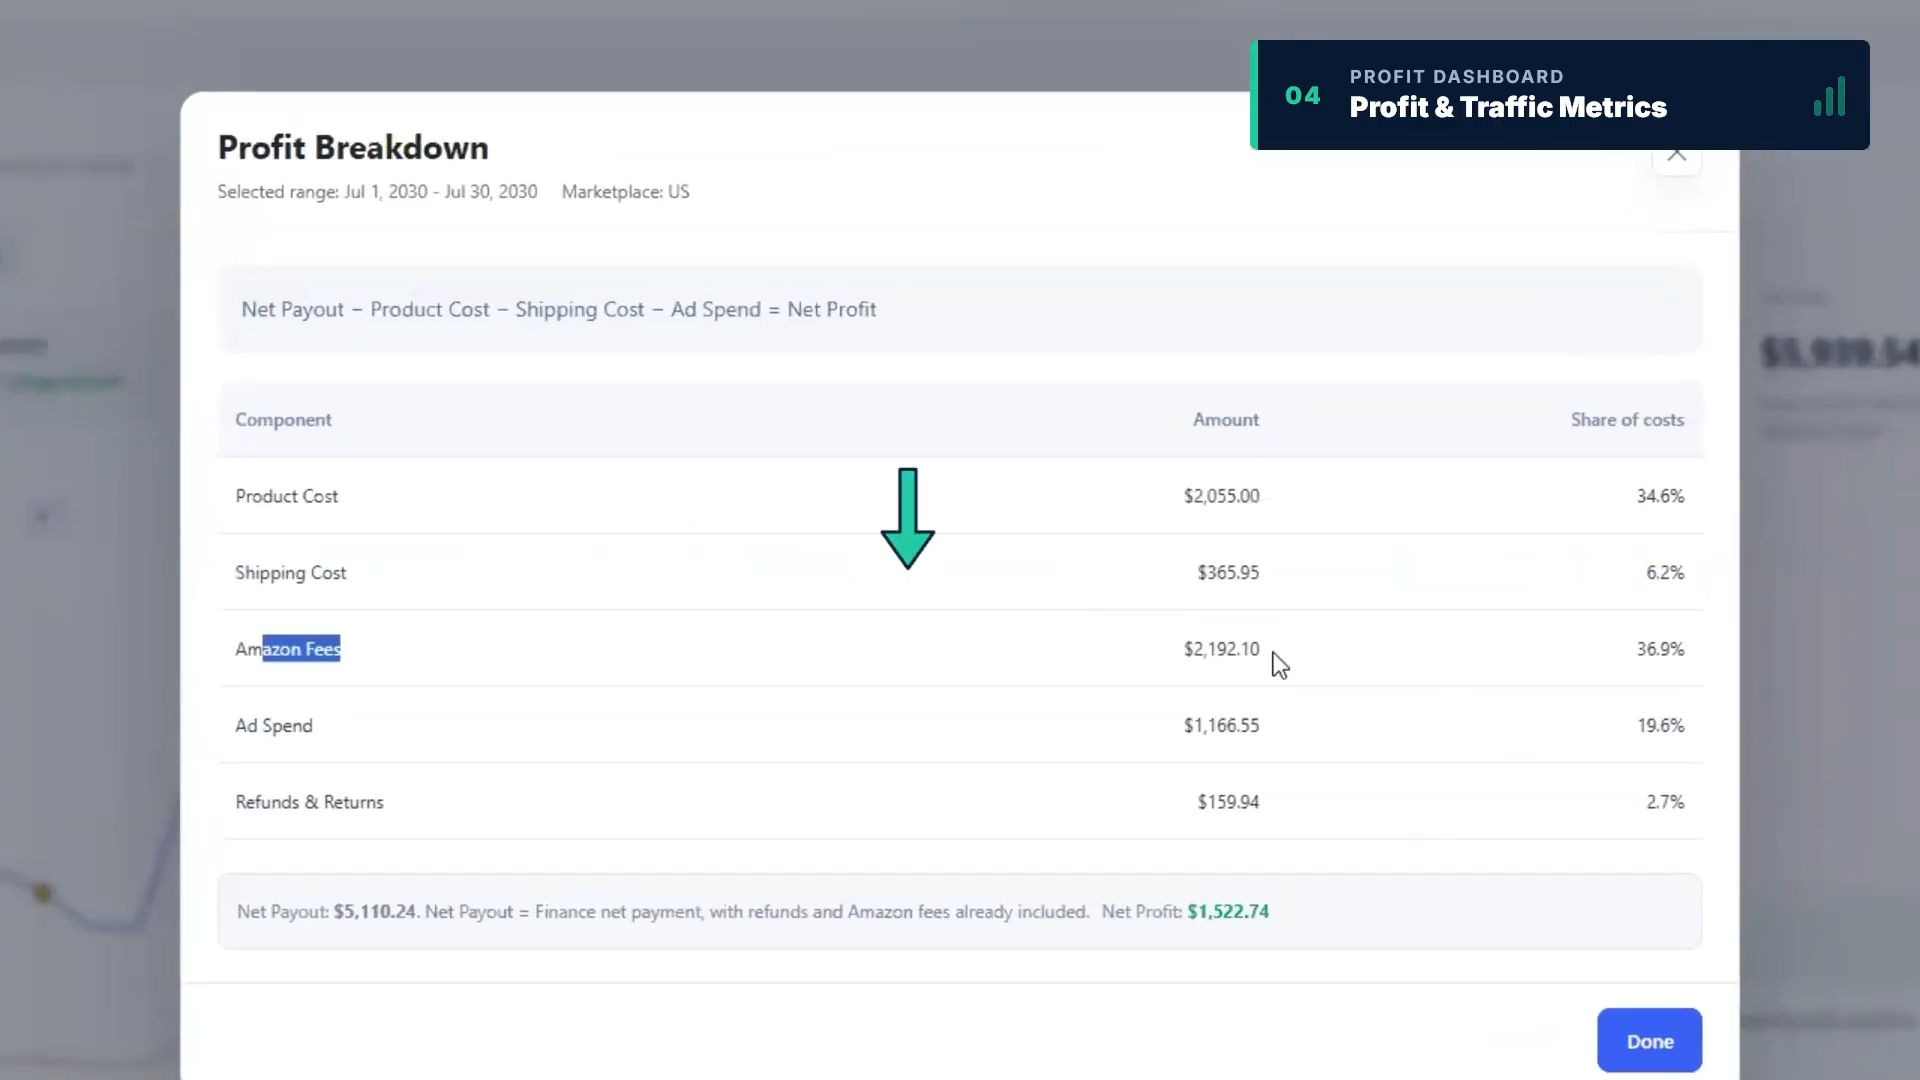
Profit Breakdown — Product cost, shipping fees, Amazon fees, ad spend, and return proportions, along with Net Payout $5,110.24 / Net Profit $1,522.74.
Traffic Funnel and Keyword/Campaign Analysis
In the Traffic Funnel, you can check impression, click, cart, and purchase metrics. With the accompanying Sales & Traffic by Date, Search Catalog Performance, Top Keywords, and Top Campaigns, you can view daily sales and traffic, keywords, and campaigns in more detail.
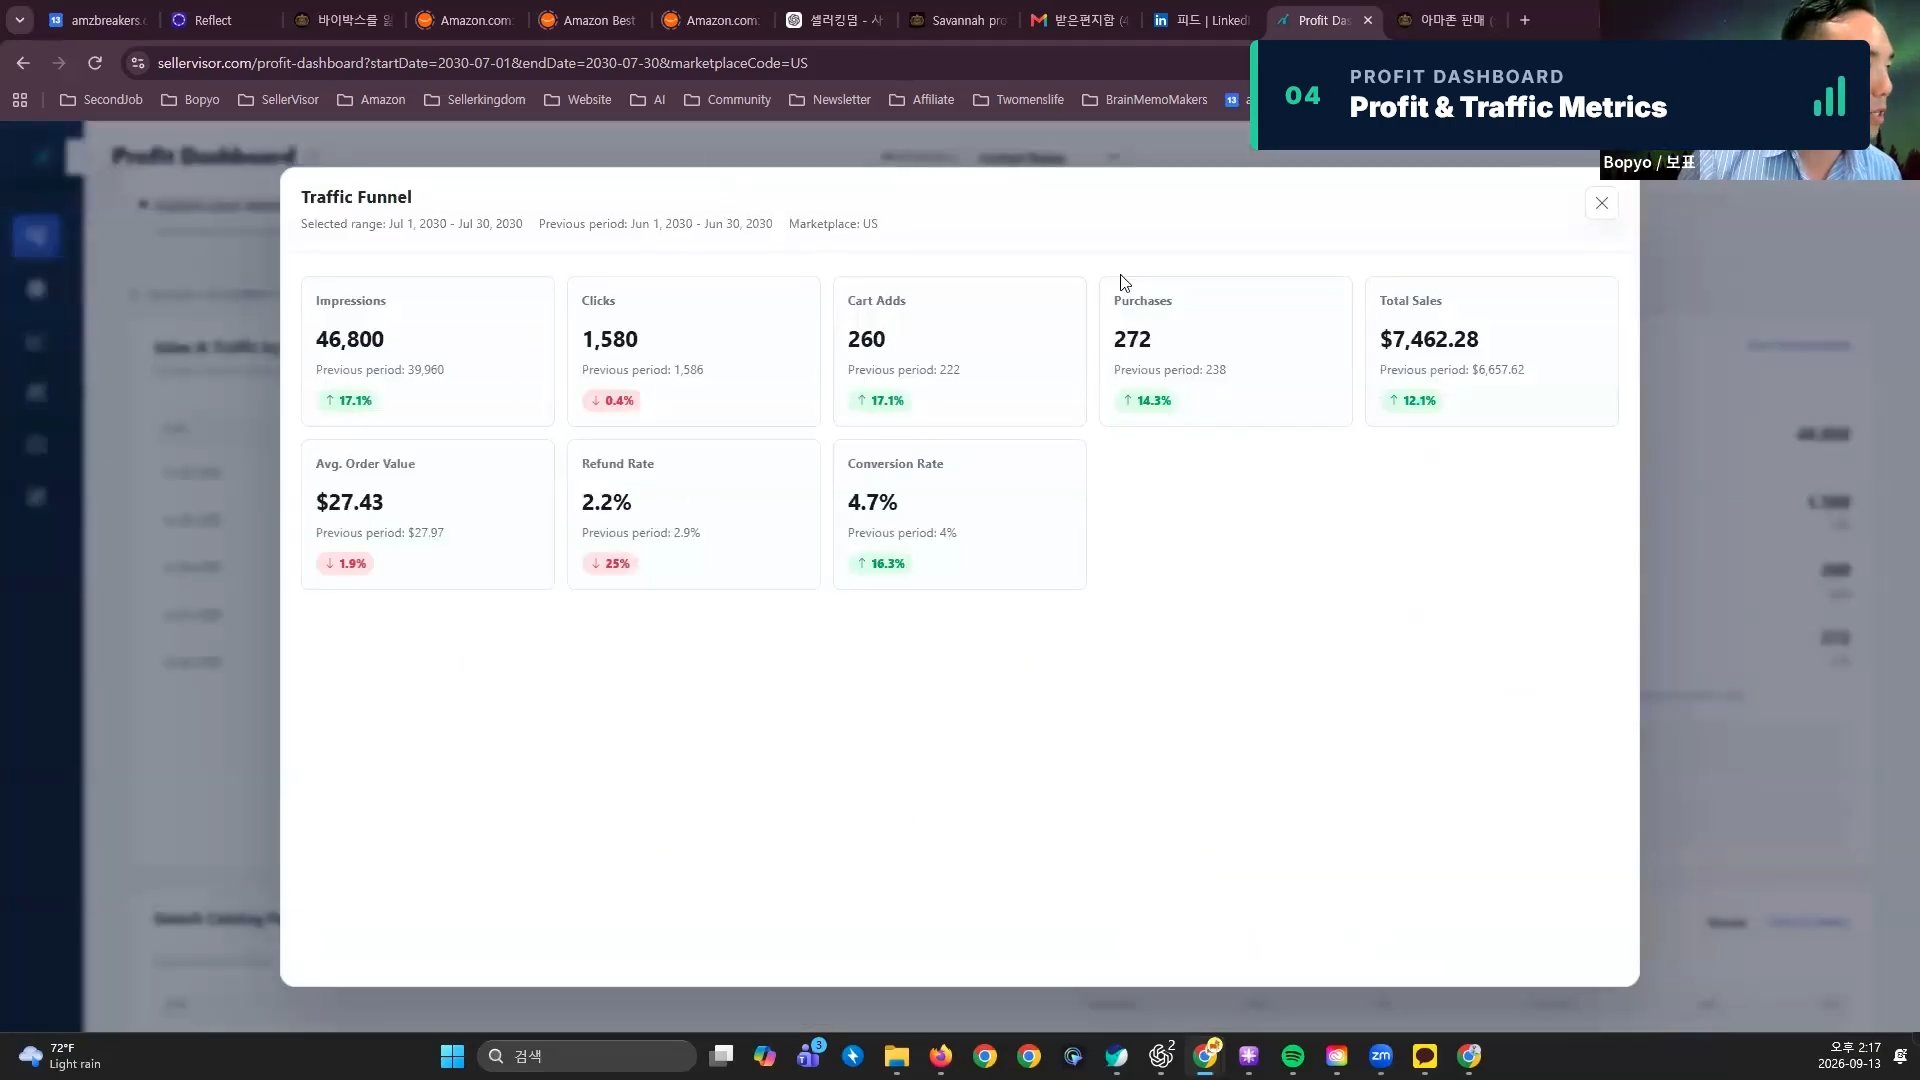
Traffic Funnel — Impressions 46,800 / Clicks 1,580 / Cart adds 260 / Conversion Rate 4.7% / Total Revenue $7,462.28 / Return Rate 2.2%.
When comparing different reports, first align the query period and aggregation criteria. It's advisable to distinguish whether the problem is increasing traffic or increasing purchases after traffic, then determine the items to improve.
Preparing for Q4: Check conversion rates before traffic increases
Under the previous conditions, if ad clicks triple from 500 to 1,500, and the selling price, CPC, and conversion rate remain the same, Seller A's estimated ad revenue will increase from $675 to $2,025, and Seller B's from $1,500 to $4,500. The sales gap between the two sellers will widen from $825 to $2,475.
If you're preparing for November and December, check your listings in this order now.
- Record the purchase conversion rate, ad spend, ACOS, and net profit for each product as your current benchmark.
- Choose one element to improve among title, image, A+ content, and price.
- Confirm that change history is automatically recorded and utilize the 7-day, 14-day, and 1-month comparison screens.
- Don't just look at sales; also consider net profit and ad efficiency to decide whether to maintain the change.
- Also record seasonal demand and changes in ad structure to reflect them in the next revision.
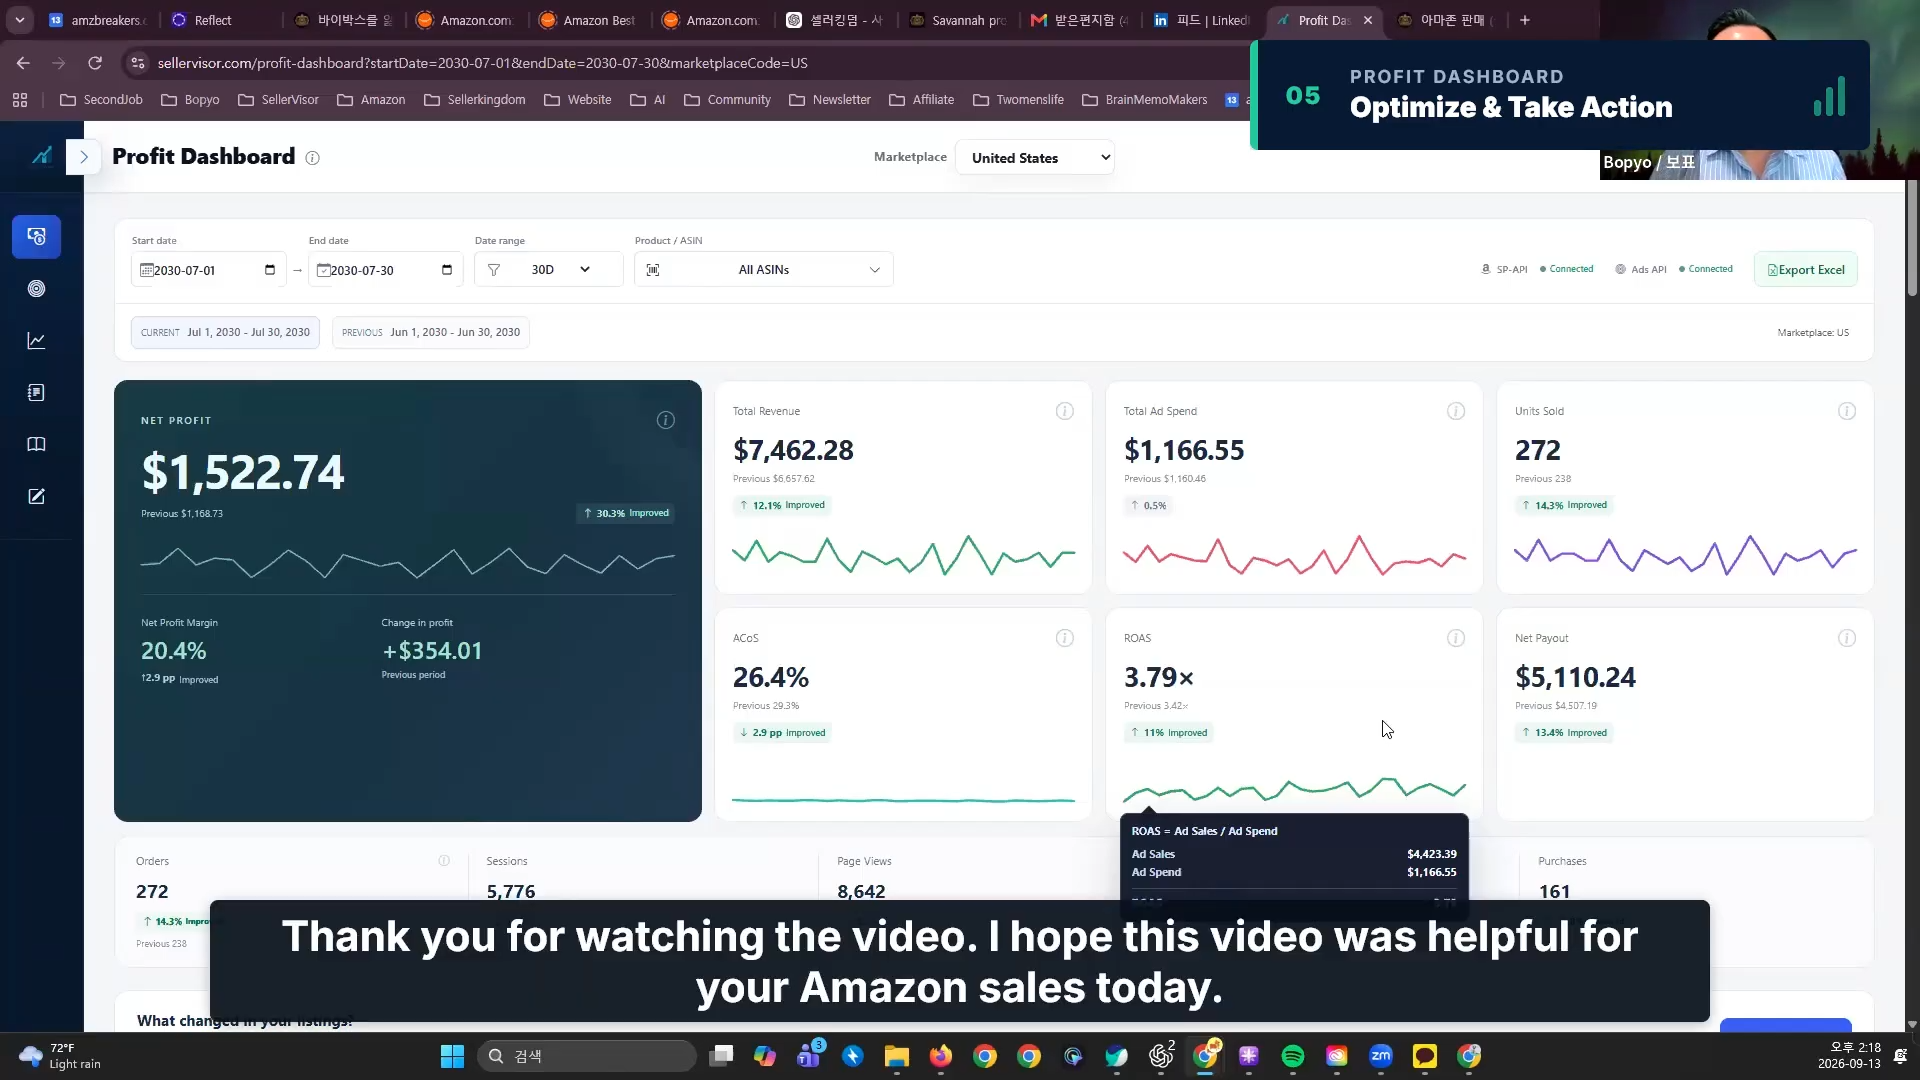
05 Optimize & Take Action — Decide on the next optimization action based on change history and metrics.
Frequently Asked Questions
What is the core of this SellerVisor Profit Dashboard update?
It's a feature that automatically records change history for listing titles, images, A+ content, prices, and more, and compares purchase conversion rates, sales, ad efficiency, and net profit before and after changes on the same screen.
Is a 10% purchase conversion rate the goal for all sellers?
No. 10% is a hypothetical simulation value in this article. It varies depending on category, price, inbound keywords, and ad structure, so you should make judgments by looking at your product's previous figures and net profit together.
Does an ACOS of 27% guarantee profit?
No. ACOS is the ratio of ad spend to ad revenue. You need to check the break-even ACOS, which includes product cost, Amazon fees, and shipping costs, along with actual net profit.
If sales increased after a listing change, is it due to that change?
Before-and-after comparison is observational data that aids judgment. The screen also states, "This is an observed comparison and does not prove the effect of the change." It's best to check factors that changed simultaneously, such as ad structure, price, inventory, and season, and if possible, change only one element at a time and repeatedly verify.
What should I check first if no data is visible on the dashboard?
In SellerVisor settings, first check the connection status of your Amazon seller account's SP-API and Amazon Ads API, then re-select the marketplace and query period.
Check it out now on the SellerVisor Profit Dashboard
Increasing the purchase conversion rate doesn't end with a single listing modification. Improvement continues when you connect change dates with before-and-after performance and reflect those results in the next modification.
On the SellerVisor Profit Dashboard, select a recently changed product and start by comparing its conversion rate and net profit.
If you're not yet using SellerVisor, start for free and begin building your listing's change history.
Start SellerVisor for Free →
Start SellerVisor for Free →