
Hello. Thank you to all customers who use SellerVisor.
It seems that if sales decrease, profit should also decrease, but in actual accounts, the opposite can happen. In this article, we outline the order for reading net profit and cost structure in the Profit Dashboard. The example is from a real account's recent 30 days (September 11, 2026 ~ October 10, 2026, US marketplace).
Where to view it
The first screen of the left menu is the Profit Dashboard. If you select the period (7D · 30D · 90D · 1Y · Custom), marketplace, and product (All ASINs or specific ASIN) at the top, all metrics will be recalculated according to those conditions. The comparison basis is the immediately preceding period of the same length. This example compares September 11, 2026 ~ October 10, 2026 with August 12, 2026 ~ September 10, 2026.
1. Start with Net Profit and Margin
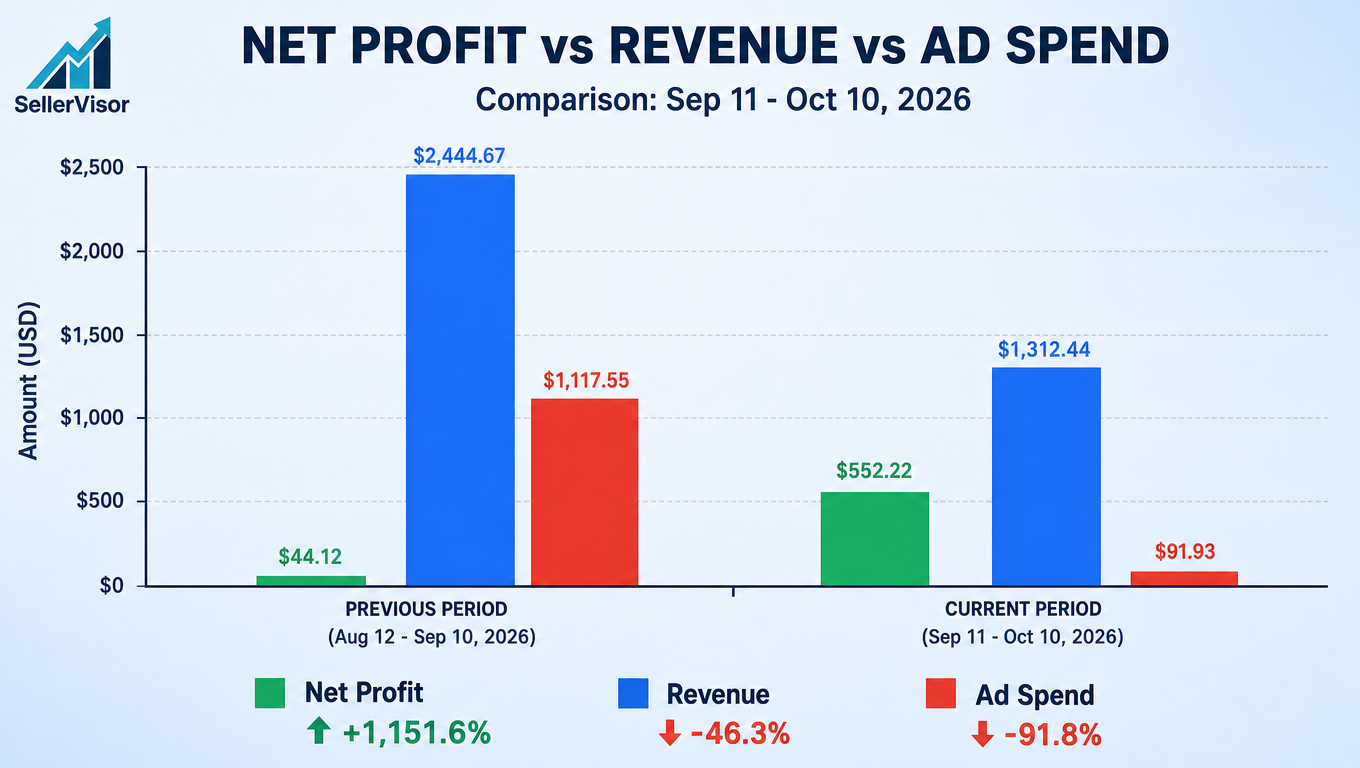
- NET PROFIT $552.22 (Previous period $44.12, +1,151.6%)
- Net Profit Margin 42.1% (+40.3 pp)
- Change in profit +$508.10
The reason for looking at net profit first, rather than revenue, is because this number is the actual money left over. During this period, even though revenue decreased, net profit increased by 12.5 times.
2. Check the Net Profit Calculation Formula
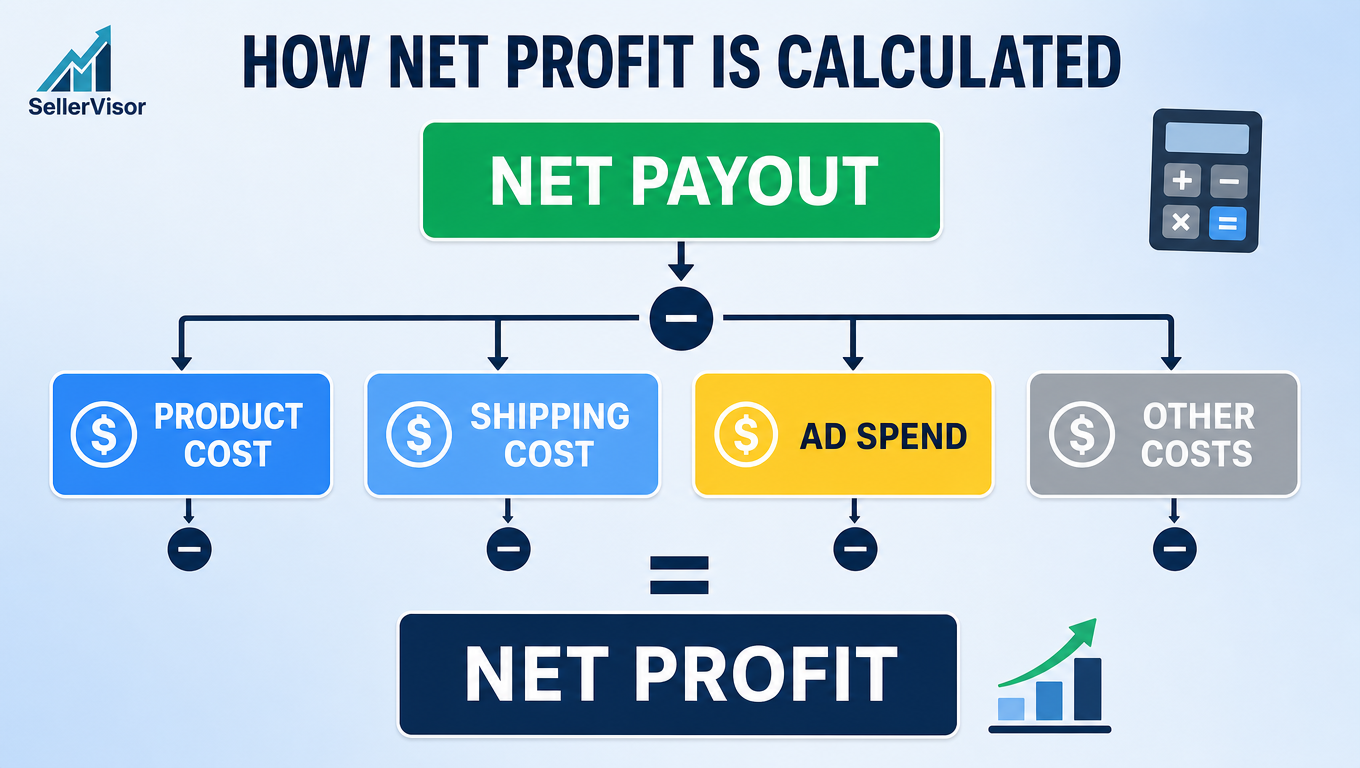
The definition displayed on the screen is as follows: Net Profit = Net Payout − Product Cost − Shipping Cost − Ad Spend
- Net Payout $961.06 (Previous $1,812.99, 47% decrease)
- Product Cost -$316.91
- Shipping Cost -$0.00
- Ad Spend -$91.93
It is important to note that Net Payout is different from revenue. Net Payout is the settlement amount that already reflects refunds and Amazon fees.
3. View Cost Structure (Profit Breakdown)
Profit Breakdown shows where the money went as a proportion.
- Total costs $1,025.81 (100%)
- Amazon Fees $527.45 (51.4%)
- Product Cost $316.91 (30.9%)
- Ad Spend $91.93 (9%)
- Refunds & Returns $89.52 (8.7%)
- Shipping Cost $0.00 (0%)
- Net Profit $552.22 (42.1%)
More than half of the costs are Amazon fees. Ad spend accounted for 9%, and during this period, advertising was not the main cause of eroding profits.
4. Check if Revenue and Traffic Moved Together
- Total Revenue $1,312.44 (Previous $2,444.67, 46.3% decrease)
- Orders 26 (Previous 59) · Units Sold 30 (Previous 60)
- Sessions 613 (Previous 1,868) · Page Views 754 (Previous 2,213)
- Clicks 132 (Previous 806) · Purchases 1 (Previous 10)
An increase in net profit doesn't necessarily mean it was a good month. Traffic decreased by a third, and there was only 1 purchase. The dashboard shows these two things side-by-side on one screen.
5. View Ad Spend and Efficiency
- Total Ad Spend $91.93 (Previous $1,117.55, 91.8% decrease)
- Ad Sales $39.96 · ACoS 230.1% (Previous 234.4%) · ROAS 0.43×
ACoS of 230.1% means that ad spend was more than twice as large as ad sales. However, since the ad spend itself was reduced to $91.93, its impact on overall profit was limited. This is closer to a result of reducing ad volume rather than improved ad efficiency.
6. View Trends and Daily Units
- Profit Overview Trend: Compare Current and Previous daily
- Average daily profit $18.41 · Best day $141.50
If you only look at the monthly total, you might miss something. If the daily average is $18.41 but the best day is $141.50, it indicates a large deviation, so it's better to check for promotions or inventory issues on specific dates separately.
Important things to check before reading: Data Missing Notice
During this period, a Missing Data Notice was displayed when opening the screen. Synchronization for 3 days of settlements/fees, 1 day of orders/revenue, and 4 days of advertising was missing, and the notification explained that the total could only reflect the dates that were synchronized. Please check this notice first before comparing periods.
Frequently Asked Questions
Can net profit increase even if revenue decreases? Yes, it's possible. Net profit is the settlement amount minus product cost, shipping cost, and ad spend. If ad spend significantly decreases, the amount remaining can increase even if revenue decreases.
What's the difference between Net Payout and Revenue? Net Payout is the actual settlement amount that already reflects refunds and Amazon fees. Total Revenue is based on order sales from Sales & Traffic, so the two values are different.
Why was there net profit when ACoS was 230%? ACoS is the ad spend divided by ad sales. Since the ad spend itself was small at $91.93, its impact on overall profit was limited. However, this does not mean that ad efficiency was good.
Is reducing ad spend always the answer? No. In this case, traffic and orders decreased together. While profit increased, growth has stalled, so the next step is to reallocate budget to keywords that show efficiency.
How do I handle a data missing notice? First, check the missing categories and dates. If a comparison is needed, change the date range to a period with no missing data and compare it with the previous period of the same length.
Conclusion
The Profit Dashboard is not a revenue screen but a profit screen. Viewing it in the order of Net Profit → Calculation Formula → Cost Structure → Revenue/Traffic → Advertising → Trends will clarify at once why this month was profitable (or not). Additionally, checking the data missing notice can reduce errors in period comparisons.
Request a Live Demo
If you'd like to check the Profit Dashboard with your own account data, please request a live demo. We will open the screen together and show you by changing periods and products.