Hello. Thank you to all customers using SellerVisor.
If you turn on bid automation and open the performance screen, and you only see Ad spend $0.00, Attributed sales $0.00, it feels like the automation is broken. In reality, it's often an optical illusion caused by misunderstanding the scope of what the screen aggregates. Let's read the SellerVisor's Auto Bid Performance (Auto Bid Performance) screen line by line with a real operating account.
1. Questions this screen answers
Auto Bid Performance is a screen that shows the performance of campaigns enrolled in automation. It is most important that this is not a screen for viewing overall ad performance. The page guide also states this:
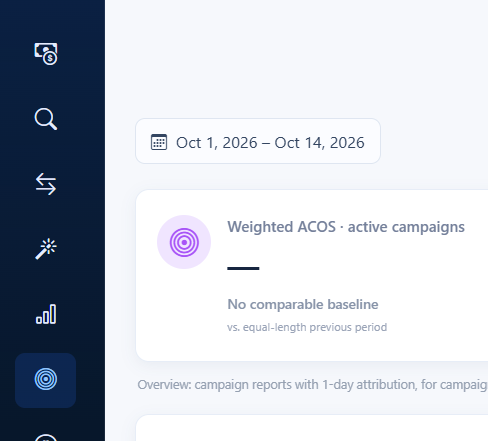
Overview: campaign reports with 1-day attribution, for campaigns currently enrolled in automation. Portfolio and campaign filters apply; keyword, table search and status filters affect the lists below.
In other words, ⑴ only campaigns enrolled in automation are targeted, ⑵ it's based on 1-day attribution, and ⑶ filters applied to the table below (keyword, status, search term) affect the lists. Knowing these three things makes the numbers much less confusing.
2. Screen configuration and reading order
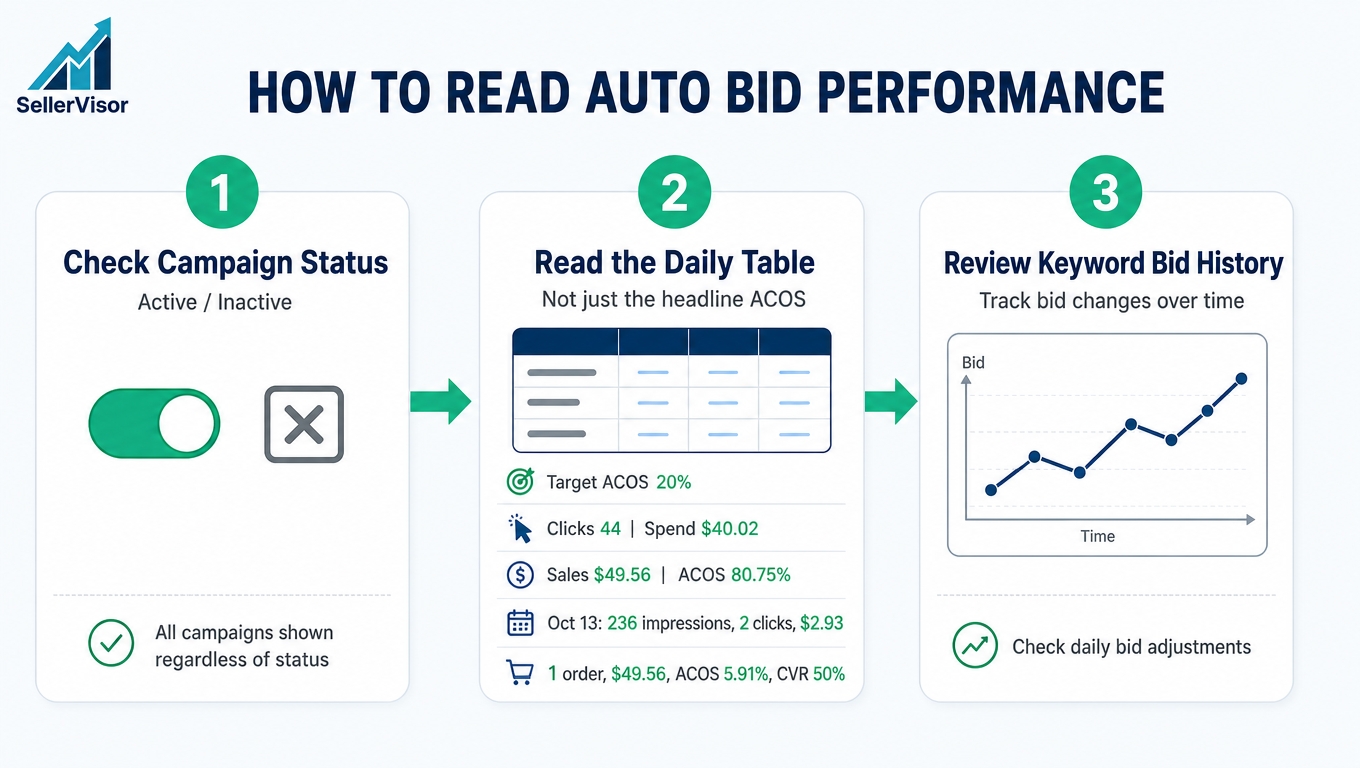
The actual usage order is from top to bottom.
- Period and Top KPIs - Weighted ACOS · Ad spend · Attributed sales · Conversion rate
- ACOS Trend Chart - Target line and actual performance based on active campaigns
- AI insights - Status summary relative to target
- Campaign performance / Keyword performance Tab - Campaign-specific / Keyword-specific details and daily data
2-1. Top KPIs are based on "active campaigns"
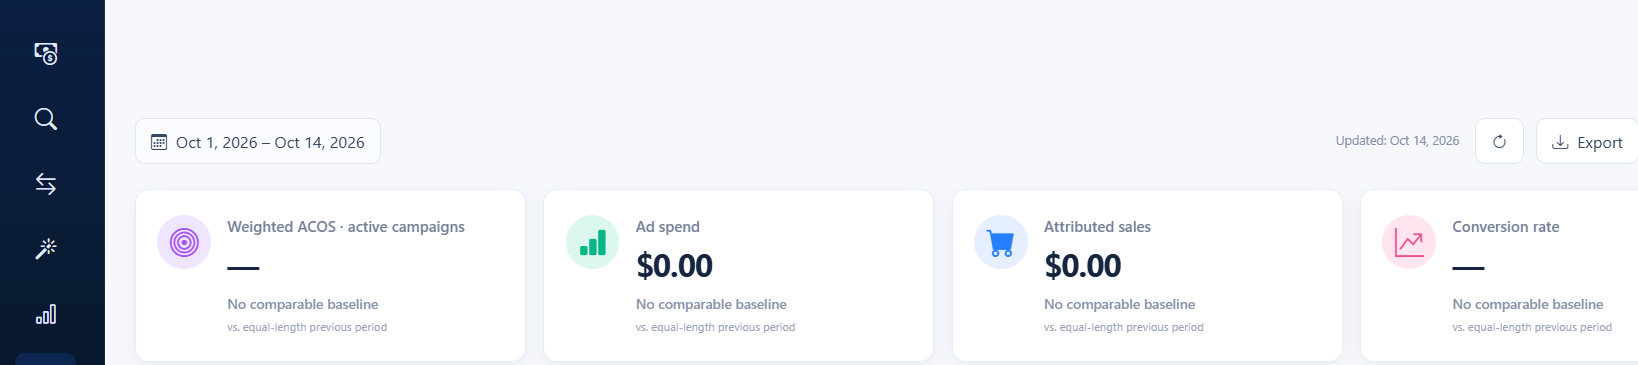
For the same period, our account values are Weighted ACOS —, Ad spend $0.00, Attributed sales $0.00, Conversion rate —, and all four cards show No comparable baseline / vs. equal-length previous period. If you stop here, it's easy to conclude that "automation did nothing," but in reality, the summary cards are calculated as 0 because there are no currently active campaigns. This screen shows "the performance of currently running automation," not "overall ad spend."
2-2. ACOS Trend where Target Line and Actual Performance Overlap
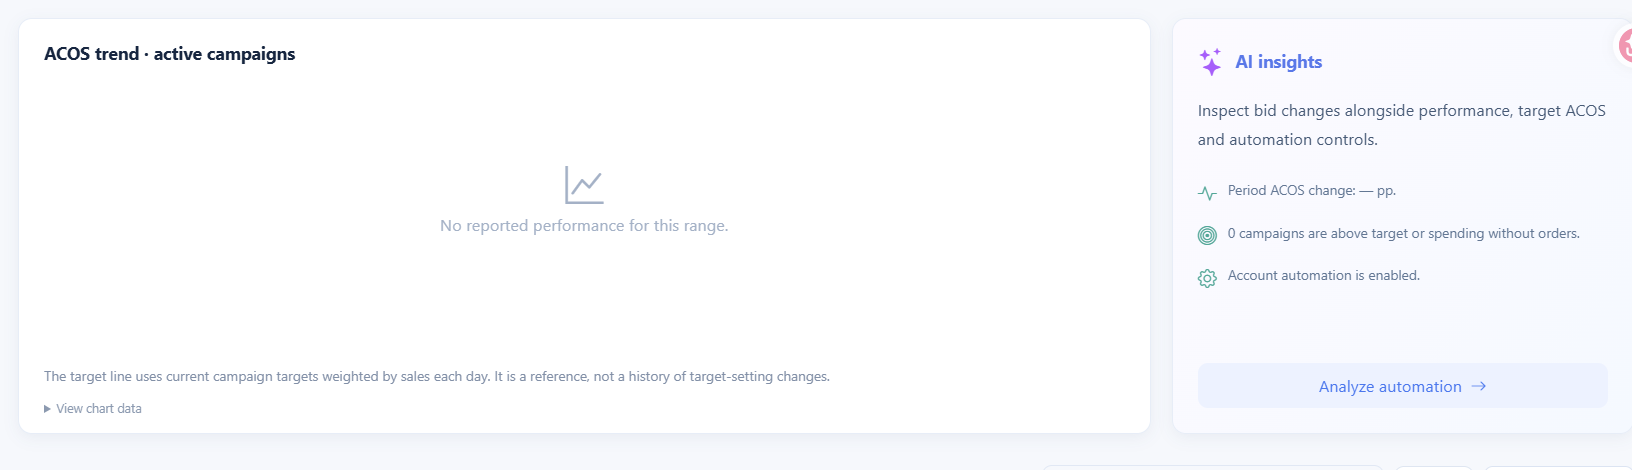
The chart shows the target line and actual performance together. As stated in the chart caption, The target line uses current campaign targets weighted by sales each day. It is a reference, not a history of target-setting changes., the target line is a reference calculated by converting "current settings" into sales weights each day, not a history of target changes. If there are no active campaigns, the chart will only display No reported performance for this range..
3. Numbers come from campaign details
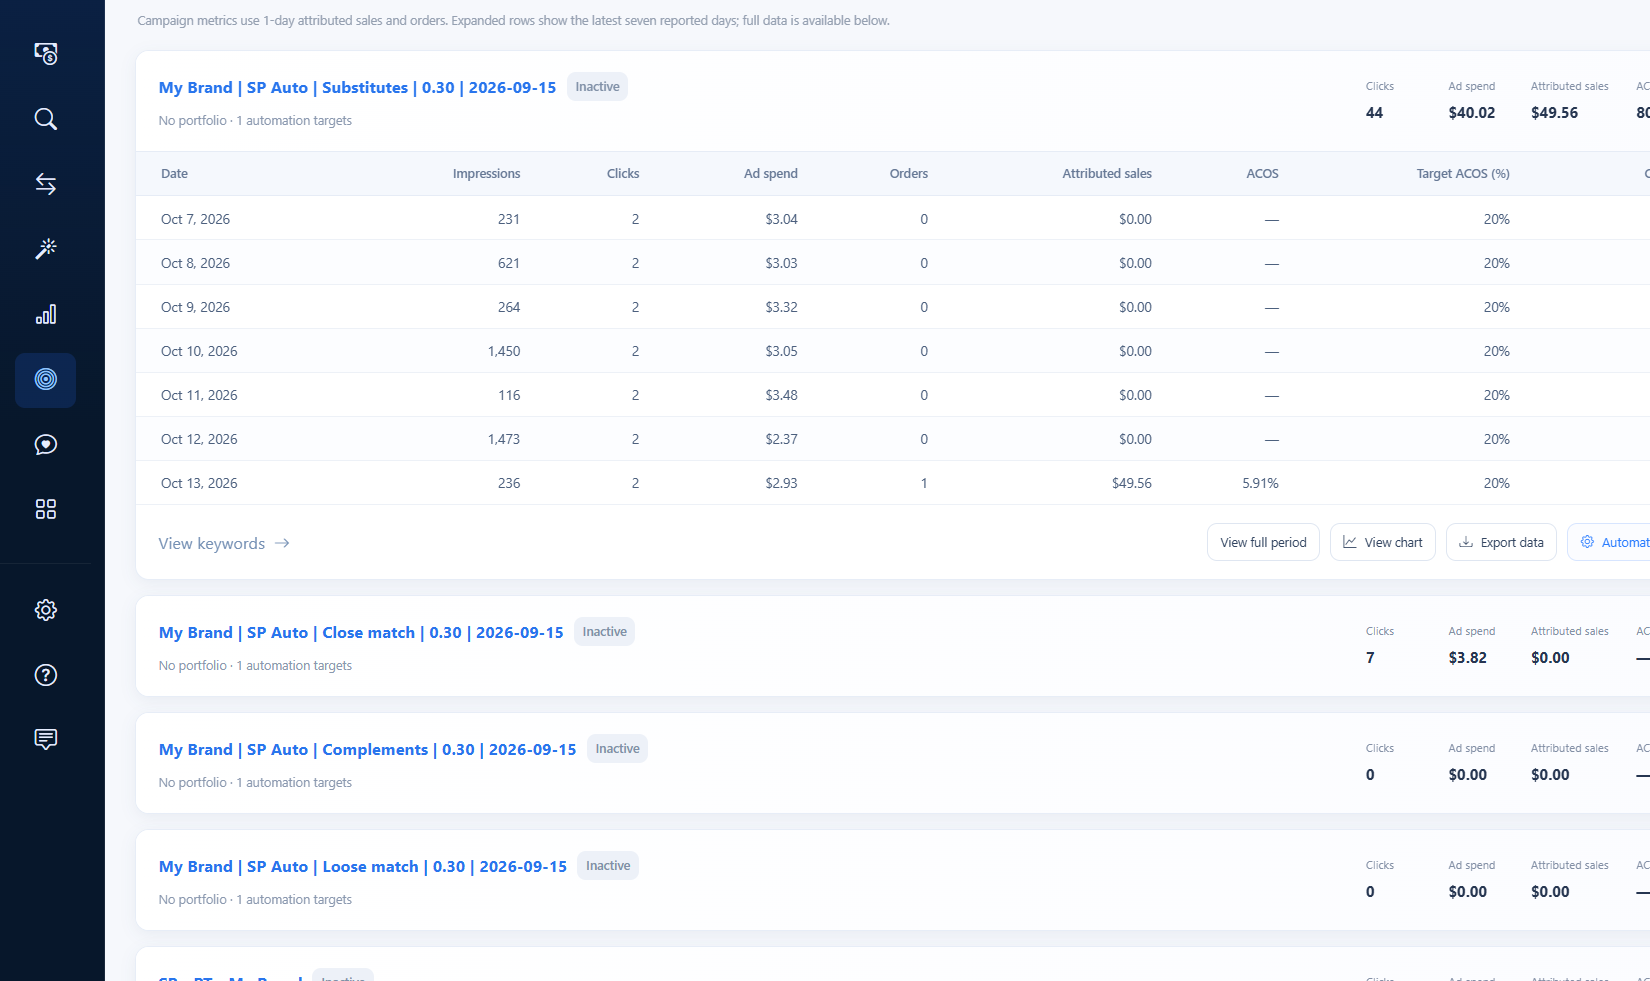
Even if the summary is 0, actual spend and sales remain in the campaign table. Substitutes was the only campaign where money moved in our account.
- Clicks 44 · Ad spend $40.02 · Attributed sales $49.56 · ACOS 80.75%
- Status is Inactive, Target ACOS is 20%
An ACOS of 80.75% is four times the target of 20%. This means that while this campaign doesn't have zero sales, it needs improvement based on the target.

3-1. A day revealed by looking at the daily table
Expanding a campaign row shows the last 7 days of data. What stands out here is October 13.
- Oct 7 - Impressions 231 · Clicks 2 · $3.04 · Orders 0
- Oct 8 - 621 · 2 · $3.03 · 0
- Oct 9 - 264 · 2 · $3.32 · 0
- Oct 10 - 1,450 · 2 · $3.05 · 0
- Oct 11 - 116 · 2 · $3.48 · 0
- Oct 12 - 1,473 · 2 · $2.37 · 0
- Oct 13 - 236 · 2 · $2.93 · Orders 1 · Sales $49.56 · ACOS 5.91% · Conversion Rate 50%
For 6 days, 2 clicks were spent daily with no orders, but on the 7th day, $49.56 in sales occurred in a single day. This is why the period ACOS dropped to 80.75%, and without this single day, the ACOS would have remained infinite (uncalculable). For smaller campaigns, the "daily table" is more useful for judgment than the "period summary."
4. Information on which campaigns are paused
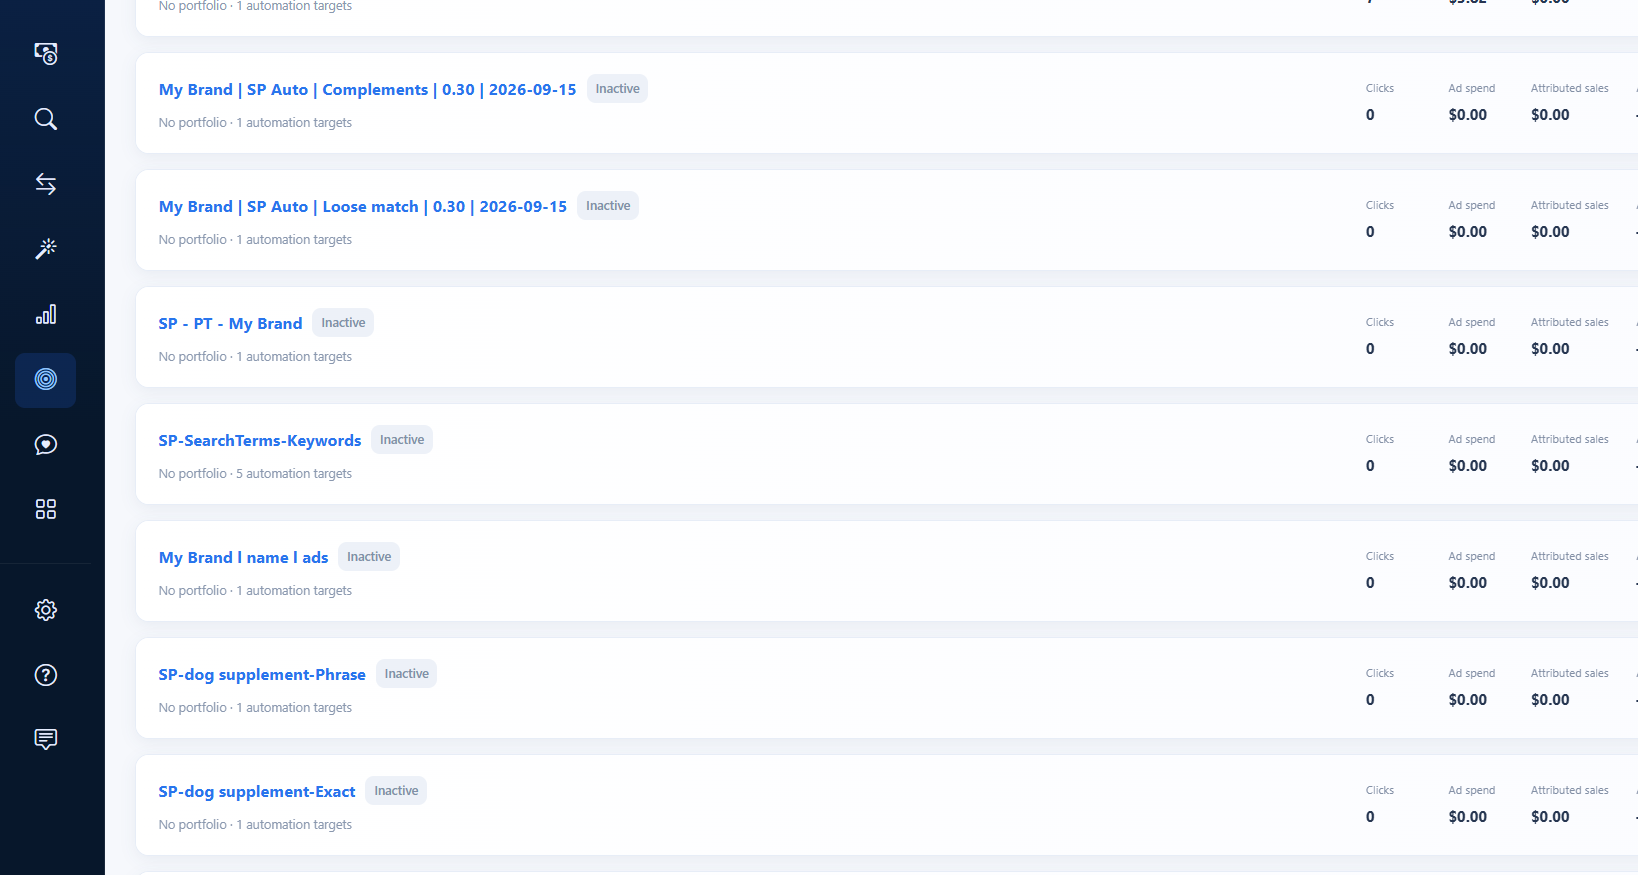
If you scroll down the list using the status filter in the same tab, most campaigns are Inactive and remain at 0 clicks · $0.00. In other words, what's needed now is not "to generate more performance" but rather to tidy up paused automation.
4-1. Check Keyword Bid History
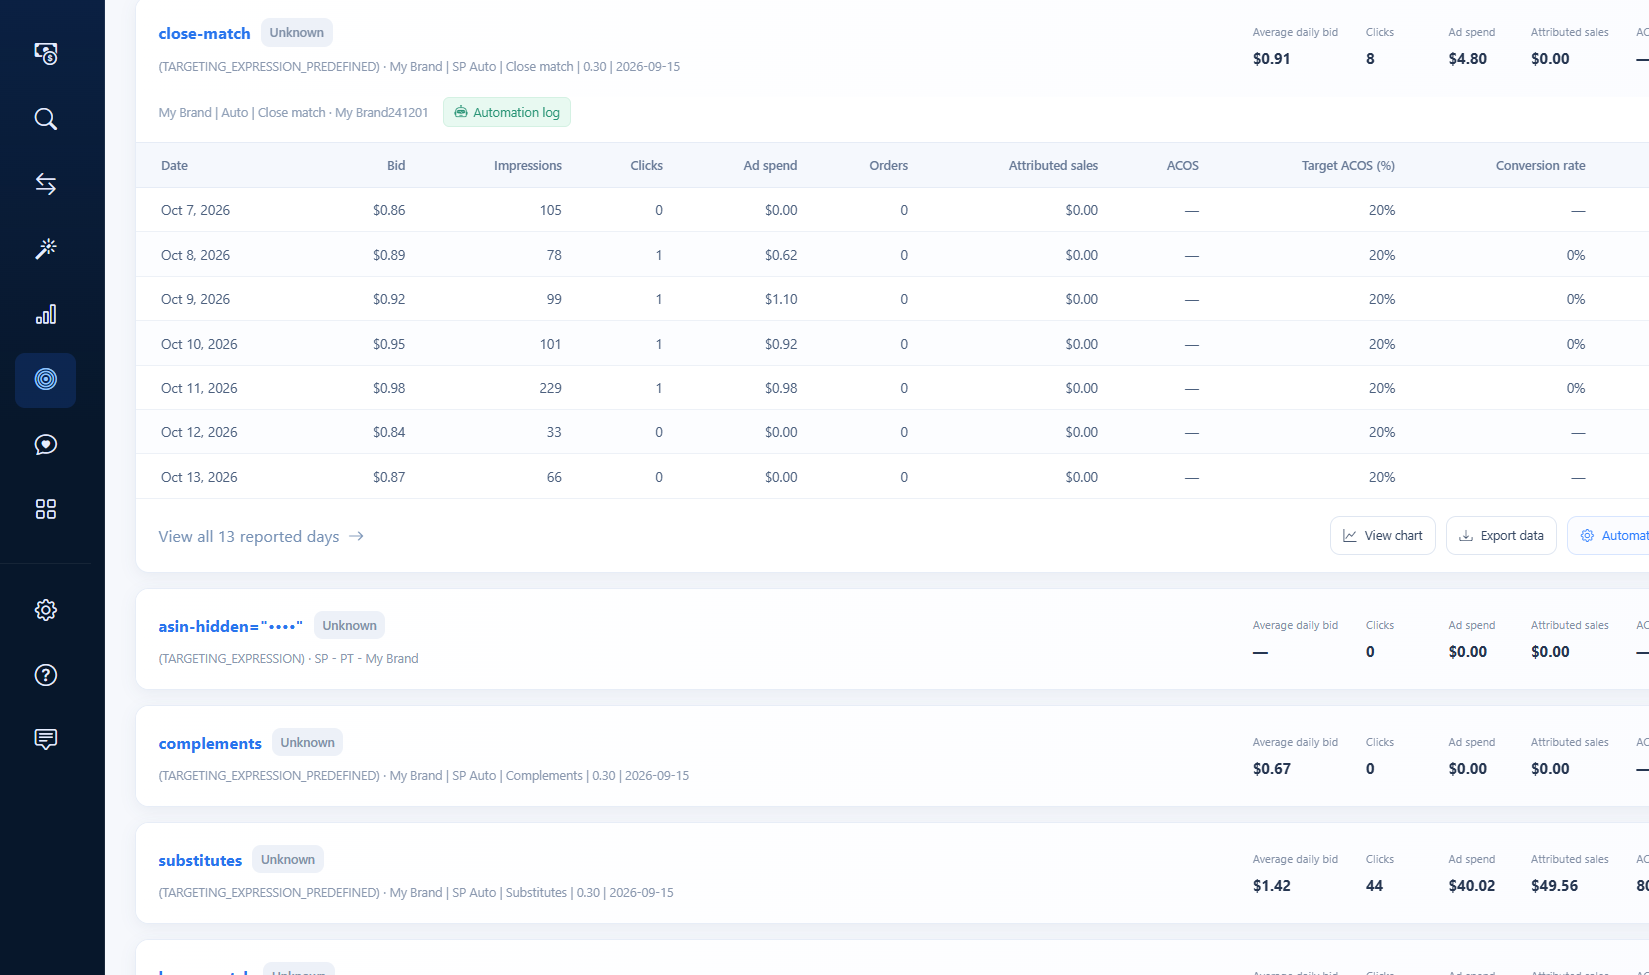
In the Keyword performance tab, you can view the average bid price per keyword and daily bid history. The close-match keyword had an average bid price of $0.91, 8 clicks, $4.80 in spend, and $0.00 in sales, with the bid price fluctuating between $0.86 → $0.98 → $0.87 over the week.

5. Actual Numbers for Our Account
A guide that only writes about guidelines and hides our account is not helpful. As of October 14, 2026, the values are as follows:
- Period: Oct 1, 2026 – Oct 14, 2026 (Updated: Oct 14, 2026)
- Weighted ACOS — · Ad spend $0.00 · Attributed sales $0.00 · Conversion rate — (All No comparable baseline)
- Campaign performance 16 · Keyword performance 21
- Account automation is enabled · 0 campaigns are above target or spending without orders
- Substitutes: Clicks 44 · Ad spend $40.02 · Attributed sales $49.56 · ACOS 80.75% (Target 20%)
- close-match keyword: Average Bid Price $0.91 · Clicks 8 · $4.80 · Sales $0.00
6. Frequently Asked Questions
Q. I turned on automation, so why are the KPIs $0.00?
The top KPIs only aggregate "currently active campaigns." If all enrolled campaigns are Inactive, the summary will show 0. Actual spend and sales remain in the campaign table, so refer to that as well.
The top KPIs only aggregate "currently active campaigns." If all enrolled campaigns are Inactive, the summary will show 0. Actual spend and sales remain in the campaign table, so refer to that as well.
Q. Does 'Inactive' mean automation is turned off?
The screen shows 'Account automation is enabled'. This means the campaign's status is Inactive, and it should be distinguished from the automation itself being suspended.
The screen shows 'Account automation is enabled'. This means the campaign's status is Inactive, and it should be distinguished from the automation itself being suspended.
Q. Why is ACOS displayed as "—"?
This occurs when there are no sales during the period, so ACOS cannot be calculated. The value will be automatically filled when sales occur (e.g., 5.91% after Oct 13).
This occurs when there are no sales during the period, so ACOS cannot be calculated. The value will be automatically filled when sales occur (e.g., 5.91% after Oct 13).
Q. What does 'No comparable baseline' mean?
It means there is no data to compare with the immediately preceding identical period. You can understand this to mean that a growth rate is not generated when there is no baseline for comparison.
It means there is no data to compare with the immediately preceding identical period. You can understand this to mean that a growth rate is not generated when there is no baseline for comparison.
Q. Where is the status filter used?
You can view the list divided into Active / Paused / Inactive / Unknown. It is recommended to use it first to check which campaigns are actually running.
You can view the list divided into Active / Paused / Inactive / Unknown. It is recommended to use it first to check which campaigns are actually running.
Q. Why does the daily table only show 7 days?
Expanding the row shows a summary of the last 7 days, and full period data can be checked in View full period.
Expanding the row shows a summary of the last 7 days, and full period data can be checked in View full period.
7. Points to Note When Reading
- The criteria for summary KPIs and the campaign table are different. The summary is for active campaigns, while the table is for all registered campaigns. It is normal for the two numbers to appear different.
- If the period is short and the number of clicks is small, the ACOS fluctuation range is large. Summary metrics can fluctuate significantly with a difference of just a few clicks.
- The target line is a reference based on current settings, not a history of target changes.
- Automation performance varies depending on the registration status (ASIN · campaign), so it is necessary to get into the habit of checking with the status filter.
Conclusion
The Auto Bid Performance screen is a tool to check "how far the automation is working" rather than "how much has been earned." Even if the summary card is 0, looking at the campaign table and daily table reveals the actual flow and which campaigns need to be tidied up. If the performance is not significant, like our account today, I believe it's better to leave it as is and find areas for improvement.
If you want to check SellerVisor's Auto Bid Performance yourself, you can request a demo. Create an account at sellervisor.com and go to Ads > Auto Bid Performance to see it immediately.