The Amazon Report Analyzer menu has been discontinued. The functionality has not been removed; rather, it has been divided and integrated into three locations to better match the actual user flow. In this article, we will guide you through where each feature has moved, in order.
1. What Has Changed
Previously, search query analysis, search term analysis, and settlement verification were all handled on one screen in Report Analyzer. Now, you can check the same data in the three locations below.
① Search Query Score → Bottom of Profit Dashboard
② Analyze Search Terms → Ads Management → Search Term Performance
③ Payment Dashboard → Profit Dashboard
2. Search Query Score Moves to the Bottom of Profit Dashboard
You can view impressions, clicks, orders, and conversion rates by search term alongside market metrics. The biggest difference is that you can immediately determine whether "this search term is advantageous for our product" within the sales context.
How to check: From the top menu, navigate to Profit Dashboard → then the Search Query table at the bottom of the screen. Period and ASIN filters can be set at the top of the screen as before.
3. Analyze Search Terms Moves to Search Term Performance
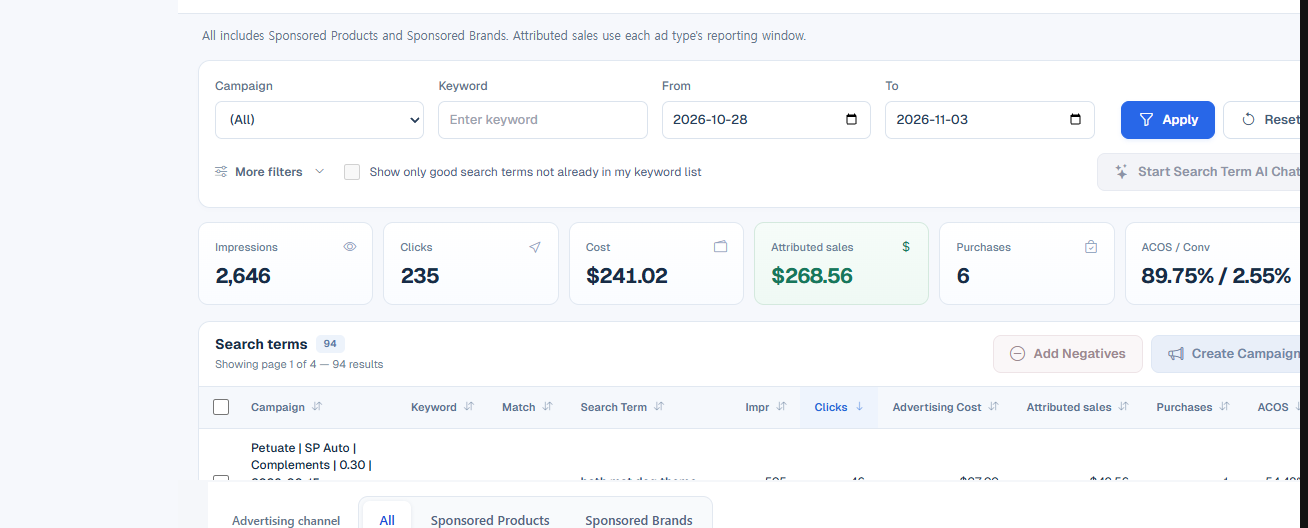
Search term-level performance analysis is handled in Search Term Performance under Ads Management. Impressions, clicks, cost, attributed revenue, purchases, and ACOS are all displayed on one screen, and low-performing search terms can be immediately organized as negative keywords.
Here is a screen example based on the last 30 days:
Impressions 12,480 · Clicks 612 · Cost $182.40 · Attributed Revenue $781.20 · Purchases 23 · ACOS 23.4%
How to check: Ads Management → Search Term Performance. In the table, if you sort by the cost column, you can see search terms with high wasted spending first.
4. Payment Dashboard Moves to Profit Dashboard
Settlement and payout-related metrics have been integrated into the top KPIs of the Profit Dashboard. The calculation formula, which subtracts product cost, shipping cost, and advertising cost from the payout amount, is displayed directly on the screen, allowing you to check the payout amount and actual profit at once.
The displayed items are Net Payout, Product Cost, Shipping Cost, Ad Spend, Net Profit, and Net Profit Margin.
5. Why Was It Integrated?
When the three features were on different screens, search terms had to be checked here, ad costs there, and settlements in yet another place. Now, by simply looking at the Profit Dashboard and Search Term Performance screens, you can check all the same data.
6. Frequently Asked Questions
Q. Will the data I used to see in Report Analyzer disappear? No. It has been moved to the three locations mentioned above.
Q. I was using bookmarks? Please change your favorites to Profit Dashboard and Search Term Performance.
Q. Where do I export? You can download it identically from the Export button at the top of each screen.
Q. What is the difference between Search Query Score and Search Term Performance? Search Query Score is a diagnostic screen viewed alongside sales and market metrics, while Search Term Performance is an execution screen focused on ad costs and ACOS.
7. Note
Screen locations may vary slightly depending on your account's plan or permissions. If you cannot see it, we will confirm it together during a 1:1 demo.
Conclusion
This change was made to allow you to view the same data across fewer screens. If you are confused about screen locations, please feel free to contact us at any time.