Hello, SellerVisor customers. Thank you for always using SellerVisor.
This update is not about adding a new feature, but rather a complete redesign of SellerVisor's screens and user flow. From market research to ad management, we've reorganized the screen composition and layout to make it faster and more convenient to view the same data.
Below, we've sequentially organized some of the new screens along with the results of running them with actual data. Since only a portion is included, it's most accurate to directly check the remaining screens yourself.
3 Key Points at a Glance
- Research, comparison, and ad management screens have been rearranged to match the actual workflow.
- We've gathered metrics and graphs on a single screen to reduce time spent searching for numbers.
- In ads, it first shows how much cost is leaking.
1. Market Research — Product Analysis with a Single ASIN
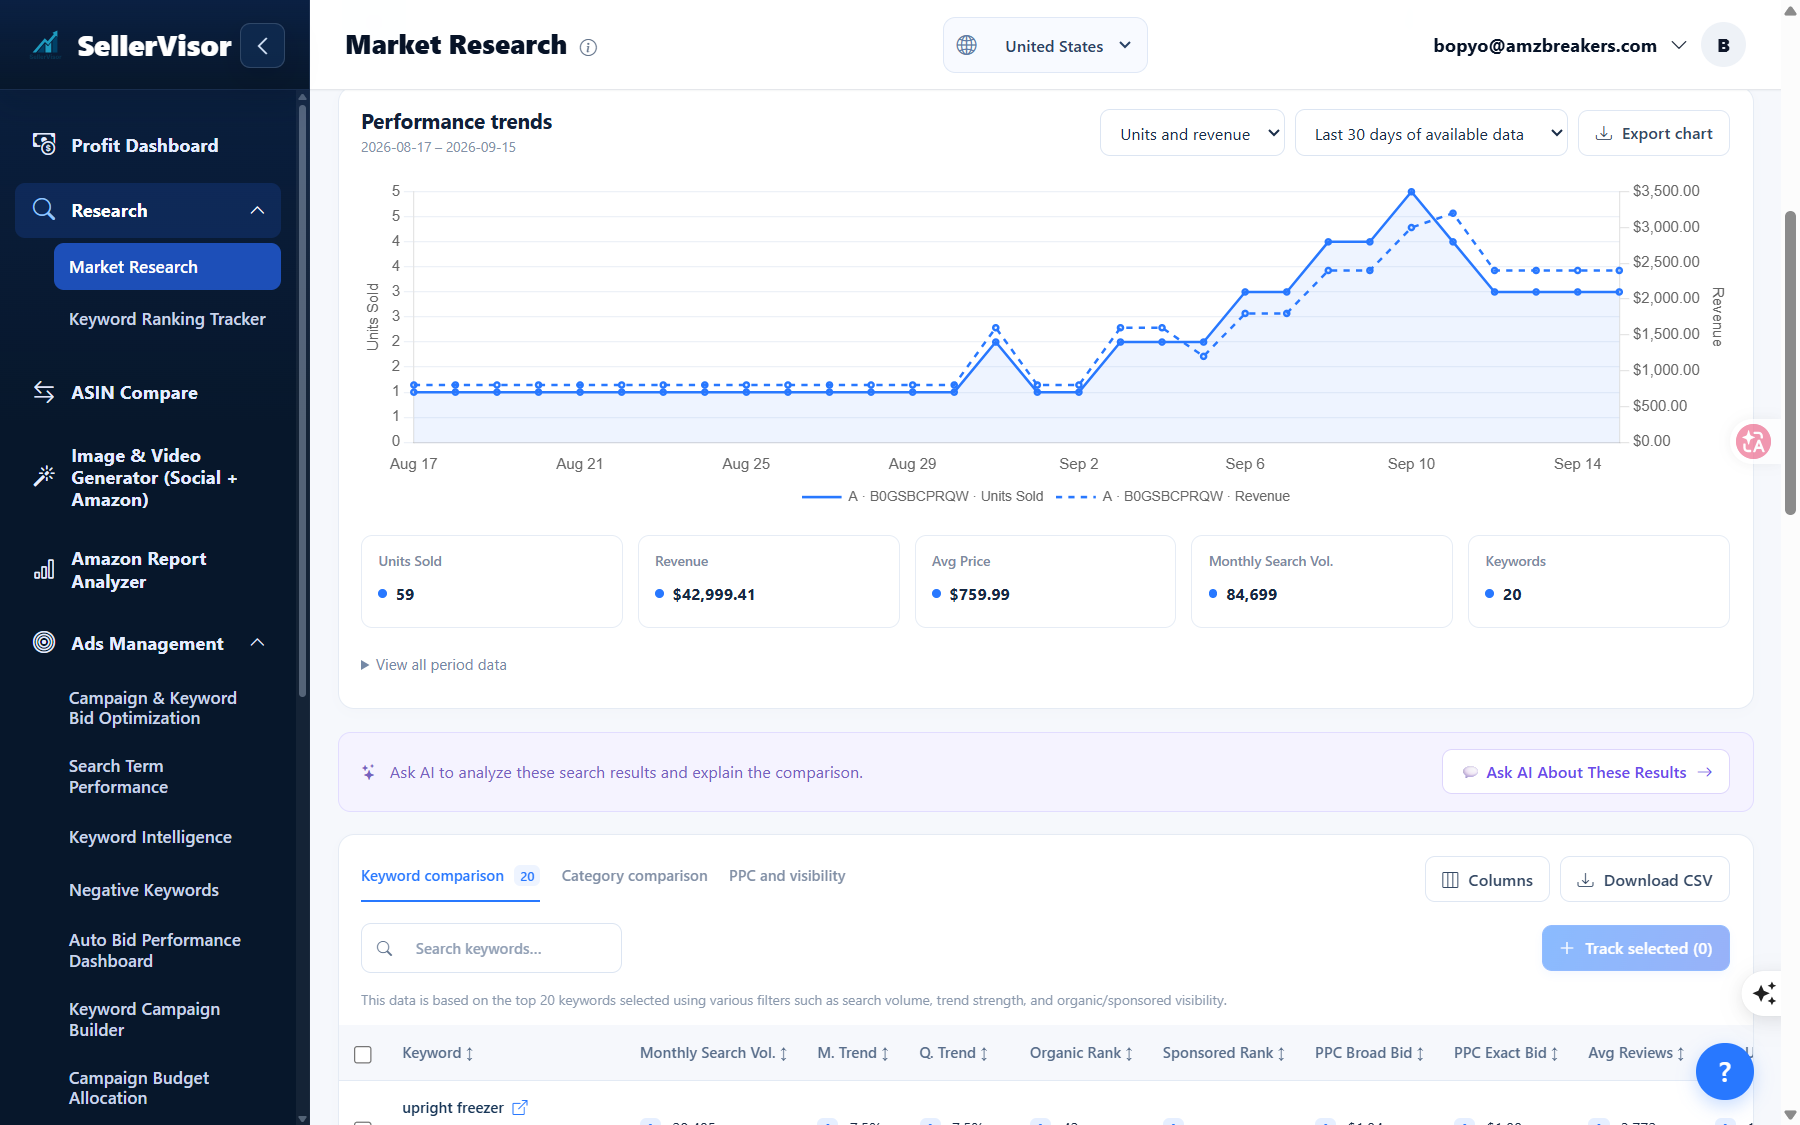
This is the result of searching for ASIN B0GSBCPRQW (11 cu.ft upright freezer). Estimated sales of 59 units, estimated revenue of $42,999.41, average selling price of $759.99, and monthly search volume of 84,699 for the past 30 days are displayed on one screen.
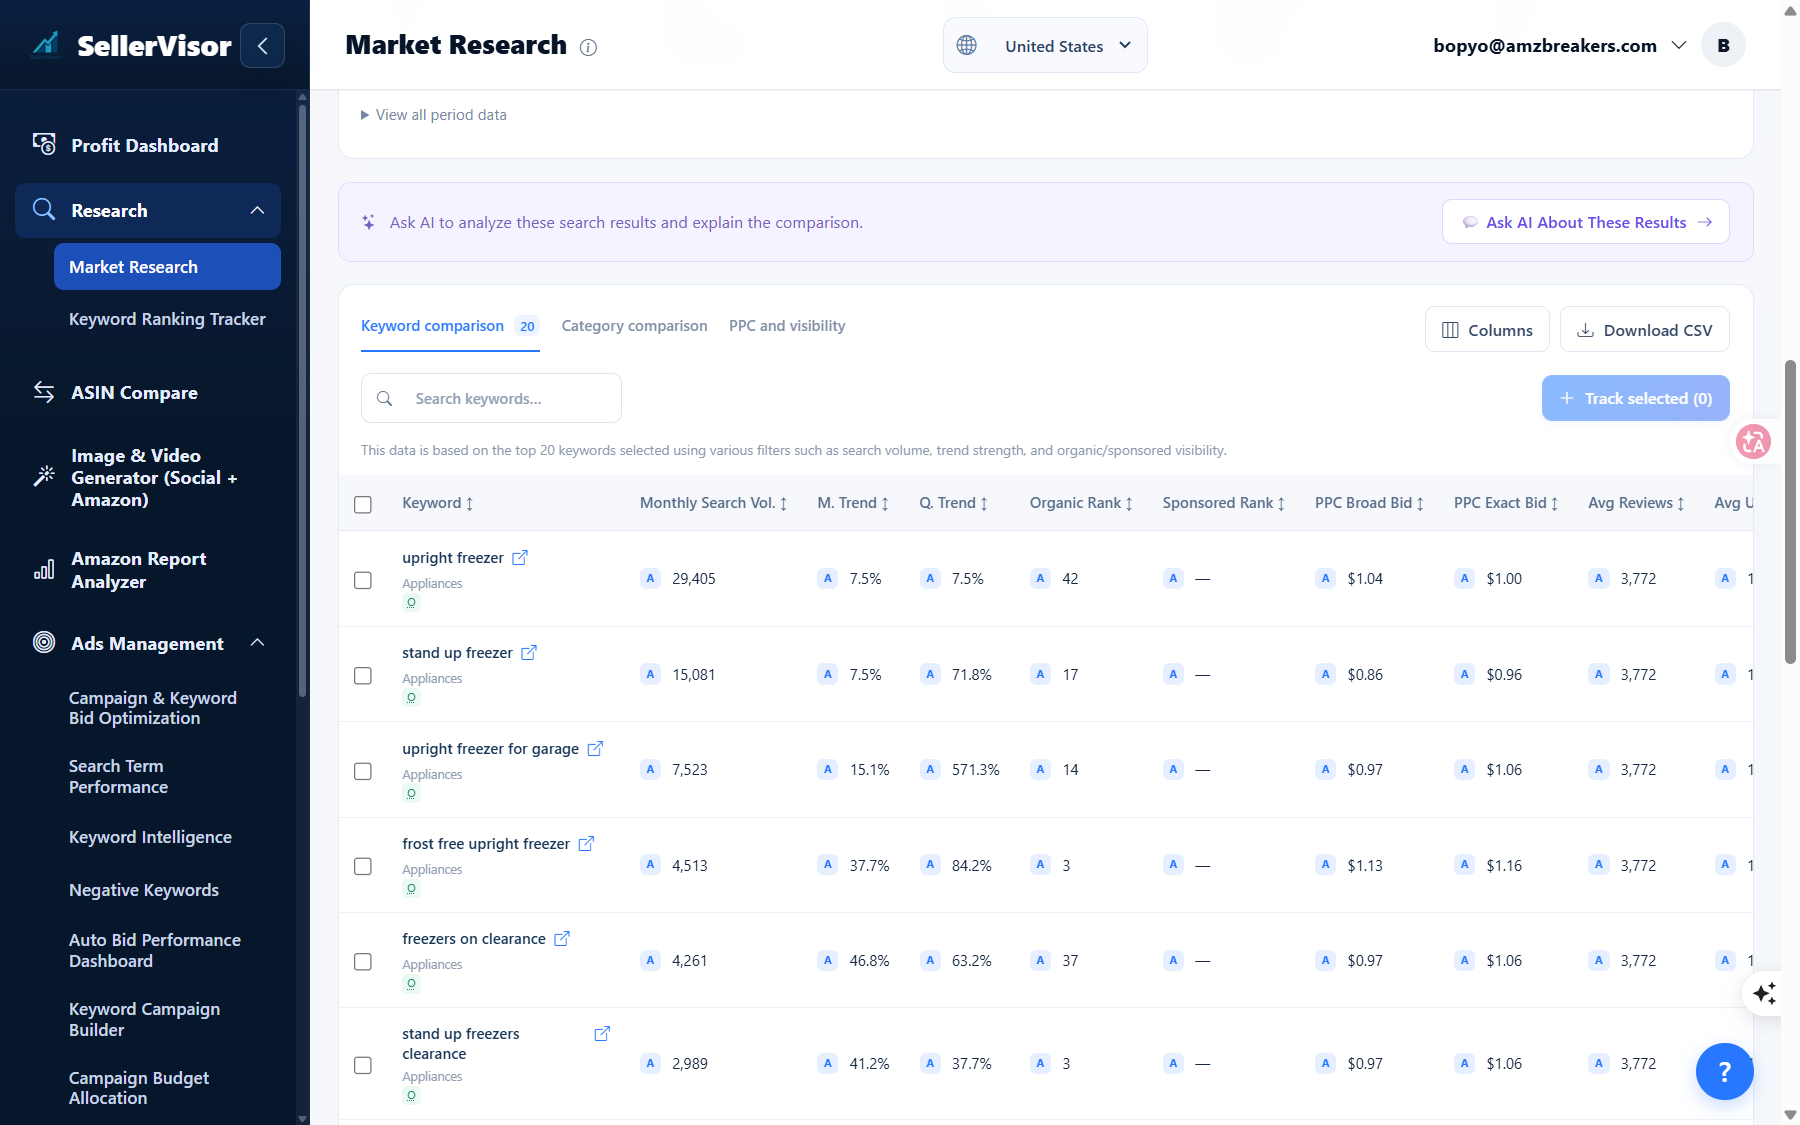
You can check trends with sales volume, revenue, price, and rank trend graphs, and on the same screen, compare the search volume, trends, PPC bid, and estimated revenue for 20 keywords linked to this ASIN.
2. ASIN Compare — Compare 2 Competing Products Side-by-Side
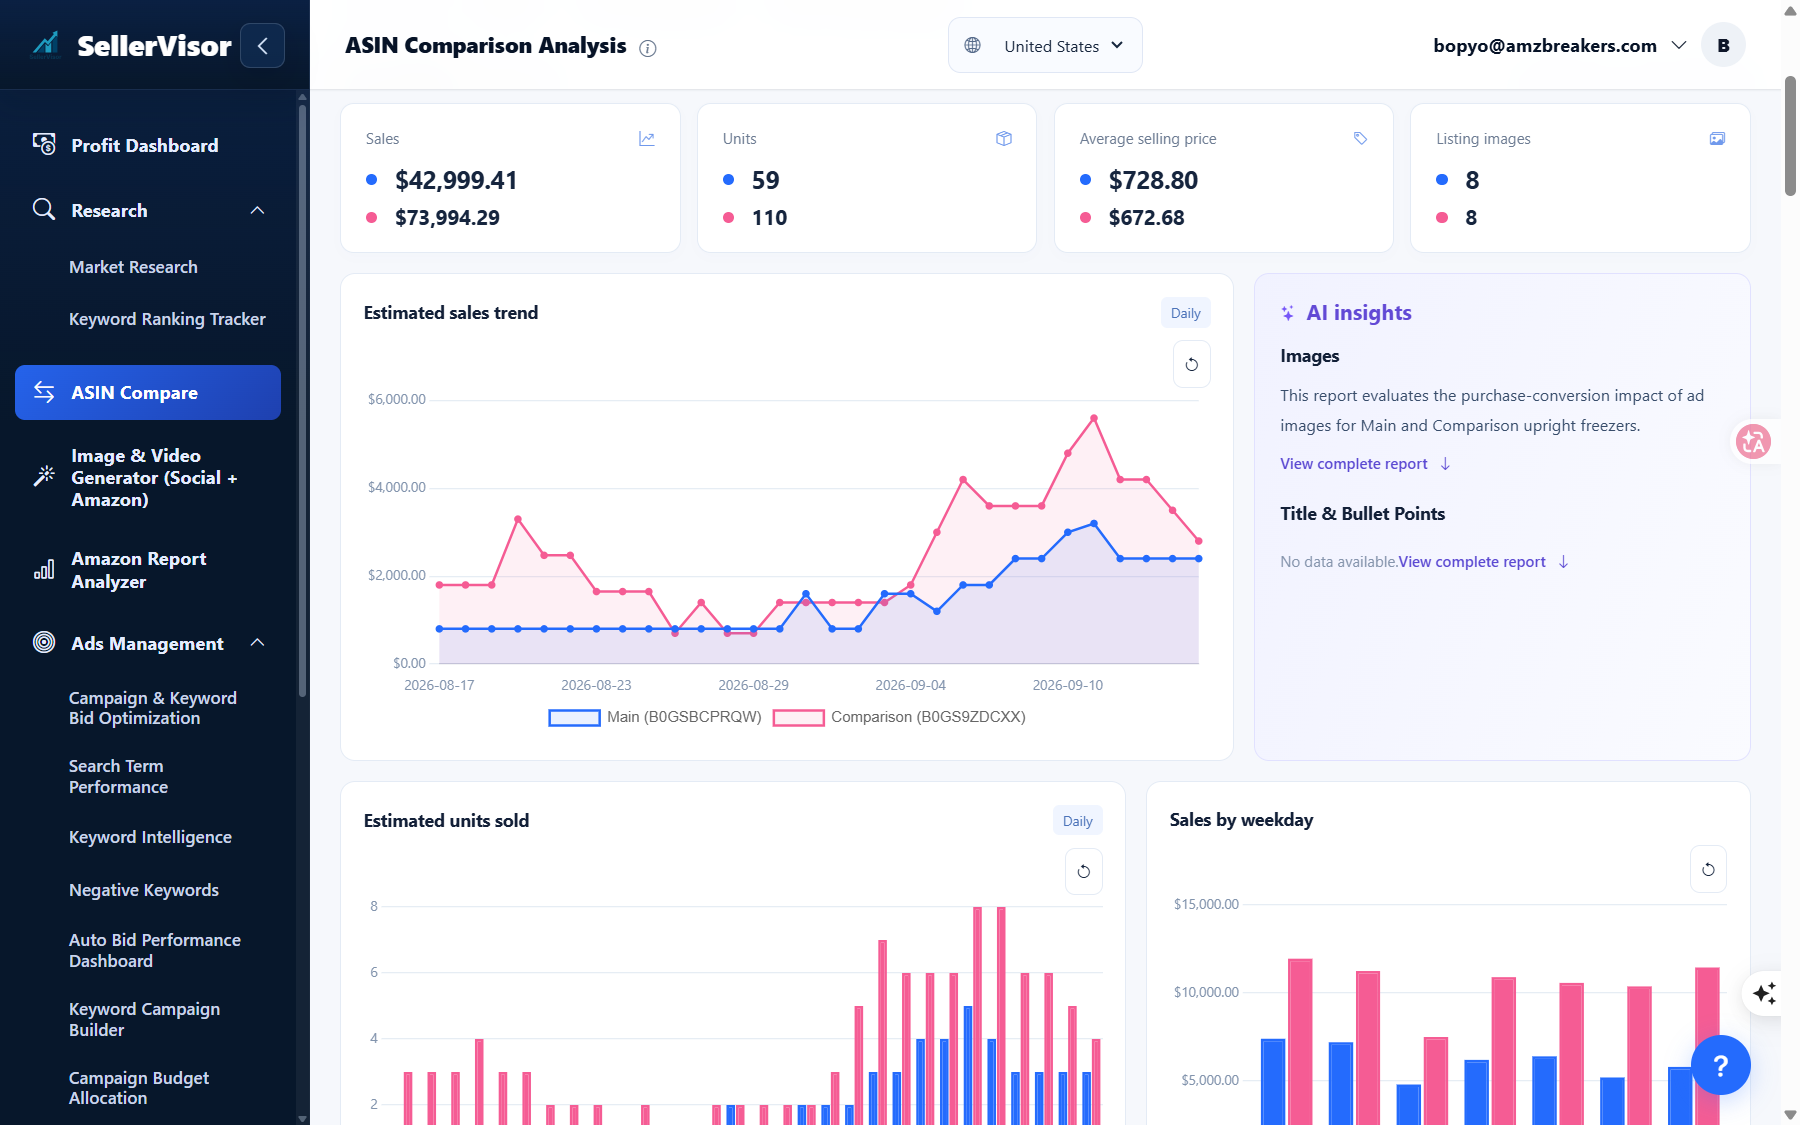
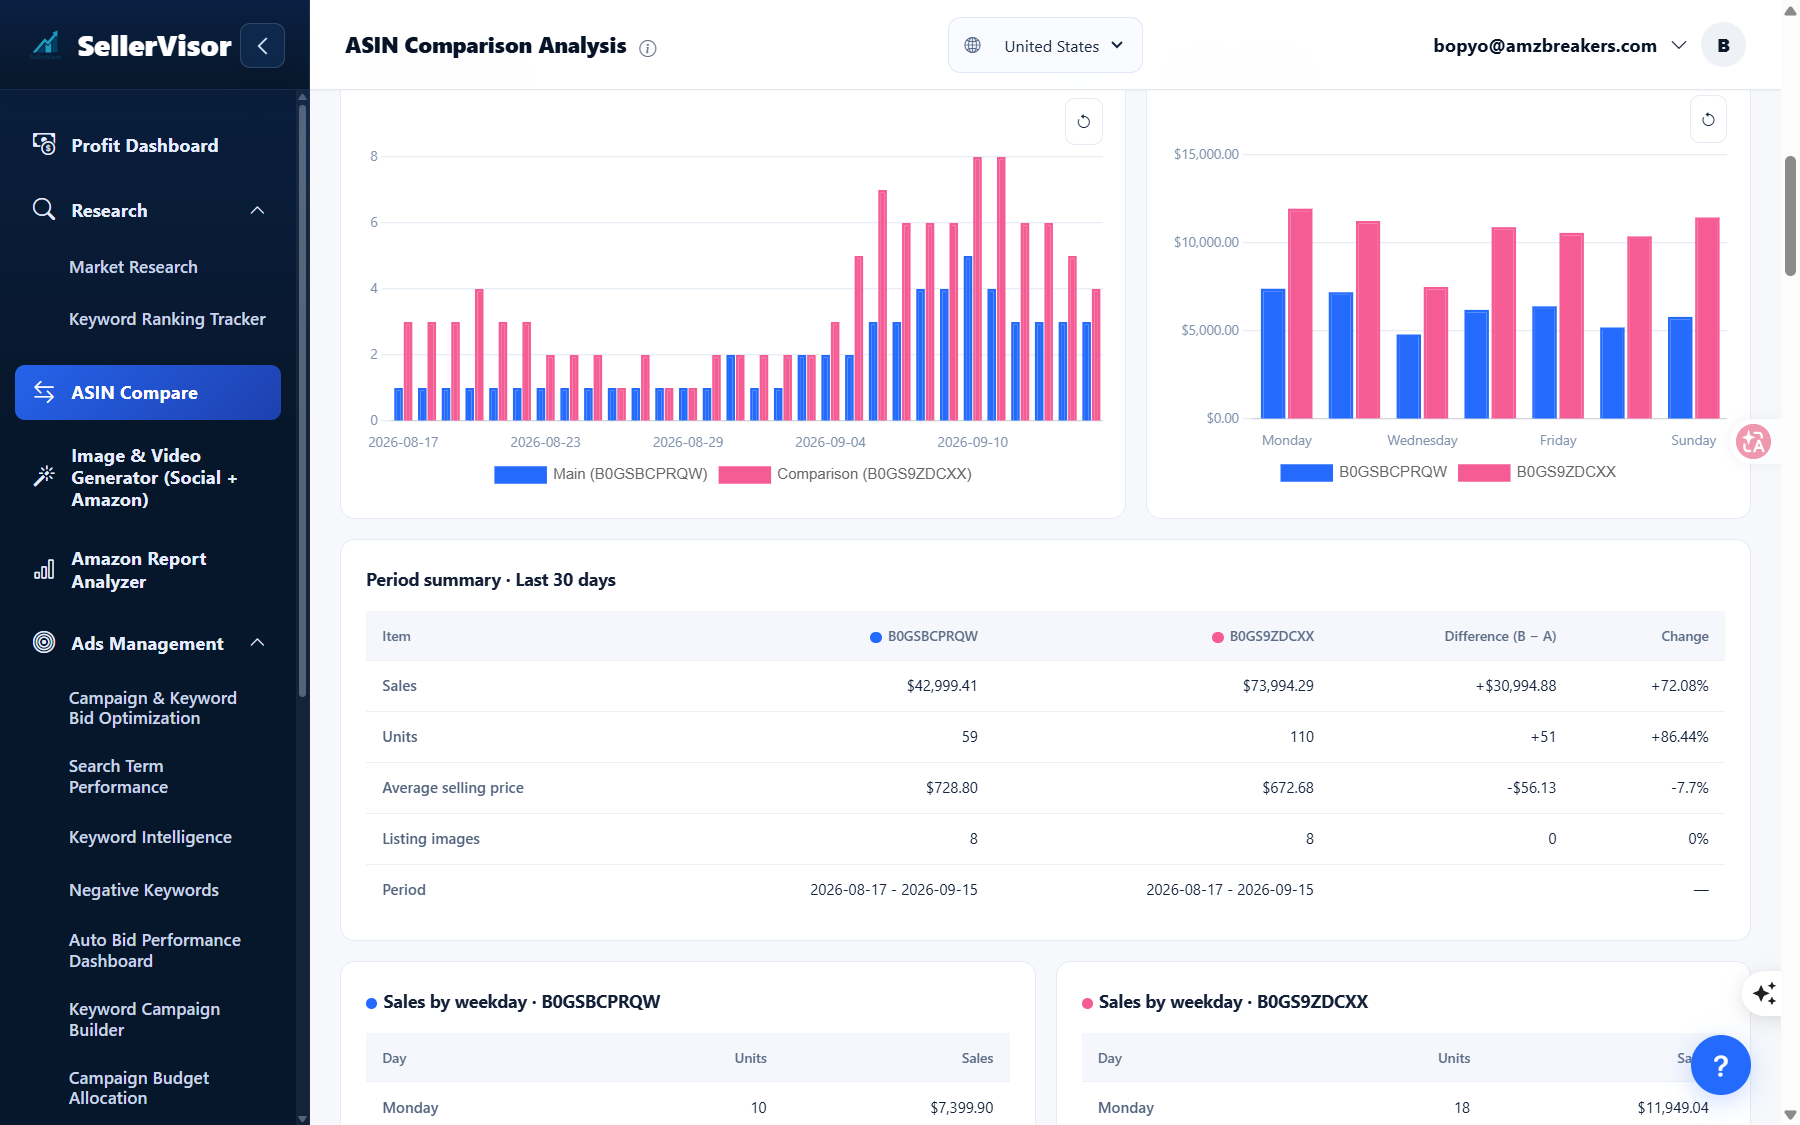
We compared two 11 cu.ft upright freezers that are actually competing on Amazon. Estimated revenue for the past 30 days is $42,999 vs $73,994 (+72%), sales volume is 59 vs 110 (+86%), and average selling price is $728.80 vs $672.68 (-7.7%).
You can check where the differences between the two products arise with daily trend graphs and sales by day of the week graphs, and we also provide image composition analysis and title/bullet improvement suggestions.
3. Ads Management — Check for Leaking Ad Spend First
The Negative Keywords screen displays potentially wasted ad spend of $288.03 (30 search terms), 308 clicks without orders, 1,014 existing negative keywords, and 46 added during this period, all on one screen.
We've made it possible to immediately see where and how much of your ad spend has been leaking and where to block it. AI performance review is also provided.

The remaining screens have also been updated
The remaining screens, including Profit Dashboard, Keyword Ranking Tracker, Image & Video Generator, and Amazon Report Analyzer, have also been reorganized based on the same criteria. If you go in and check them out, you'll immediately notice the changes.
If you want to watch a video first
Recently, we uploaded a video on the official SellerVisor YouTube channel summarizing how to analyze performance before and after listing changes in the Profit Dashboard. (10 min) Amazon Seller, Did sales increase after changing the listing? Performance Analysis Method Before and After Changes
Please share your feedback
Please feel free to let us know if there's anything that was helpful or inconvenient while using it. We will continue to improve based on actual operating experience. Participate in the Feature Review Survey
Thank you for always being with us.
SellerVisor Team
SellerVisor Team