 SellerVisor
Profit Dashboard
Understand the numbers behind your profit
Review revenue, costs, advertising, and net profit by marketplace and date. Compare periods and inspect the products and changes behind the totals.
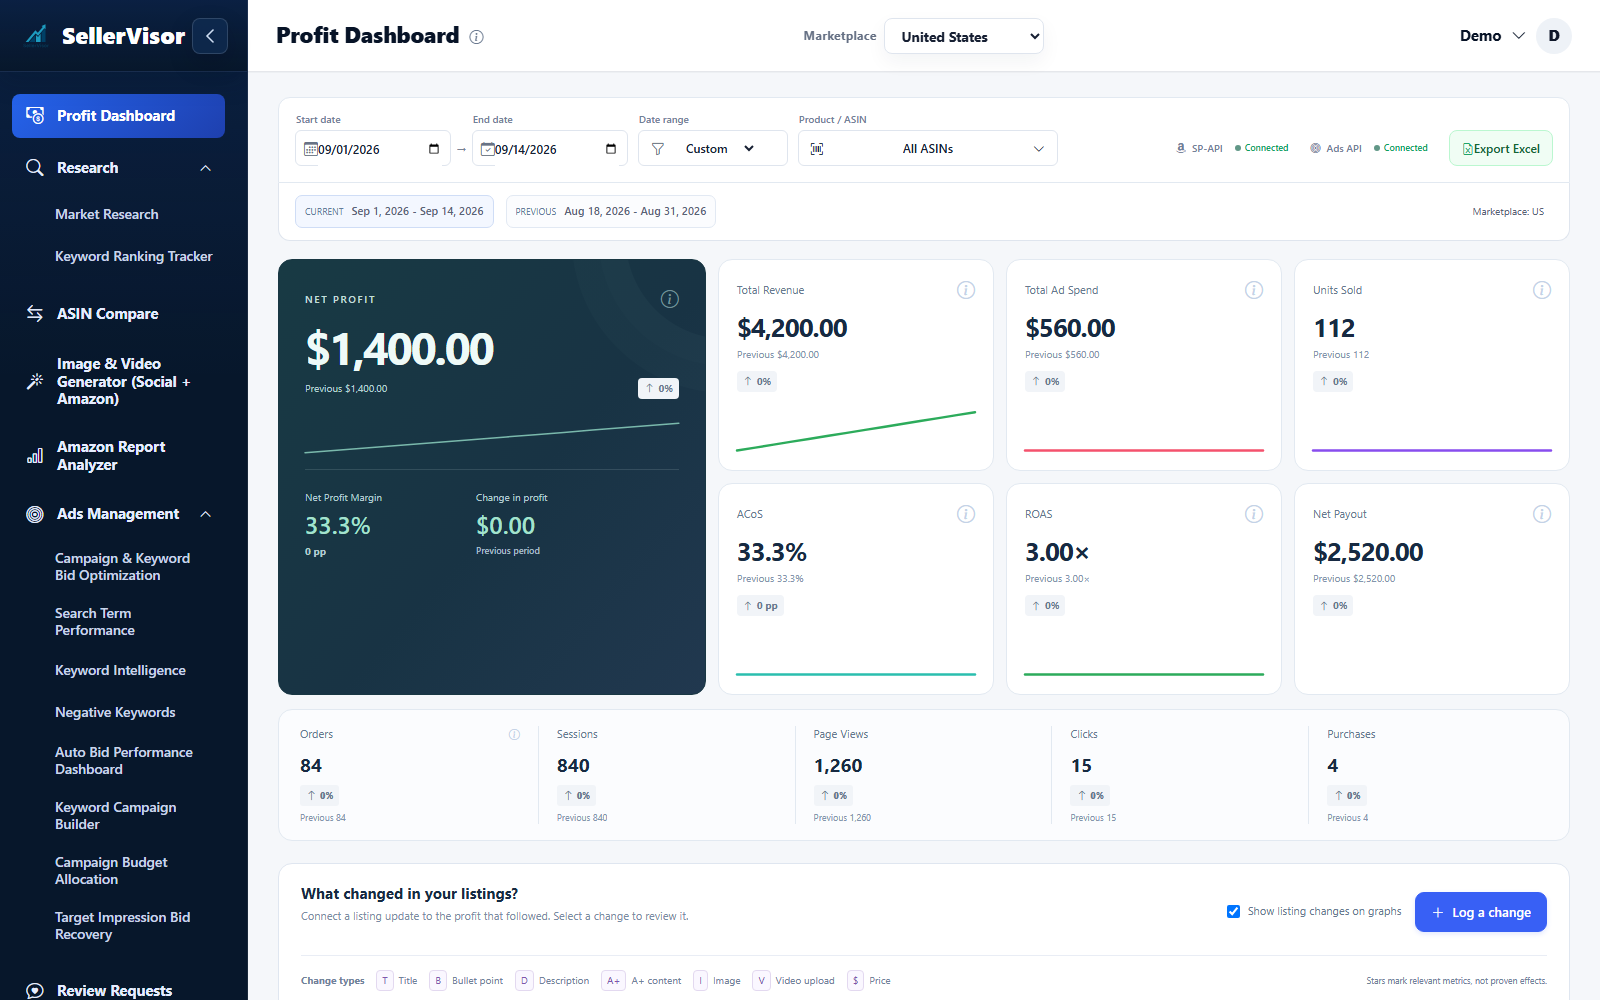
1
Reports & profit
Set the marketplace, dates, and ASIN
- Open Profit Dashboard and check the marketplace and Amazon connection indicators. Choose a date preset or custom start/end dates, then select All ASINs or one product.
- Read the Current and Previous date labels before comparing changes. Available history depends on your plan and synchronized data; check missing-data notices instead of treating unavailable values as zero.
2
Reports & profit
Read the summary and profit trends
- Review net profit, revenue, ad spend, margin, ACOS, and ROAS together. Revenue alone does not show profitability; use the comparison values to see how each metric changed.
- Use the Profit Overview chart to compare profit, revenue, and advertising over time. Switch daily, weekly, or monthly views and hover a point for its values. Listing-change markers connect the timeline to recorded edits.
3
Reports & profit
Inspect costs and the profit calculation
- Open the Profit Breakdown to inspect Amazon fees, refunds/returns, product cost, shipping, and ad spend. Net profit uses net payout minus product cost, shipping cost, and ad spend; Amazon deductions are already reflected in net payout.
- Use Configure Costs to review purchase and shipping costs when the numbers look incomplete. Inspect the category details before changing values, and save only the costs you intend to use.
4
Reports & profit
Find the products driving profit or losses
- Review Top Profit Drivers by revenue, advertising spend, net profit, margin, and units. Compare margin alongside sales volume so a high-selling product does not hide weak profitability.
- Open the full product list or select an ASIN in the top filter to investigate it. The reconciliation amount explains the difference between the displayed product rows and the overall profit total.
5
Reports & profit
Explore traffic and advertising reports
- Expand Explore your detailed reports to review sales/traffic, catalog performance, funnel metrics, campaigns, and keywords. Use View All where available to inspect the full table.
- Compare campaign and keyword spend with attributed sales, clicks, and purchases. ACOS is ad spend divided by ad sales; ROAS is ad sales divided by ad spend. Keep the selected period and data availability in mind.
6
Reports & profit
Compare performance around listing changes
- Click a listing-change marker or recent-change item to see the old and new values. Review the before/after metrics for that ASIN using the available 7-, 14-, or 30-day window.
- Check the exact comparison dates and any unavailable-metric explanations. The change day is excluded from the comparison; review other campaign or market changes before attributing the result to a listing edit.
Screenshots are in English and may contain sample data. Available features depend on your plan, connections, and data.