 SellerVisor
Listing Analysis
In-depth listing comparison to decide what to improve first
Walk through image quality, copy clarity, and performance signals in a single side-by-side view.
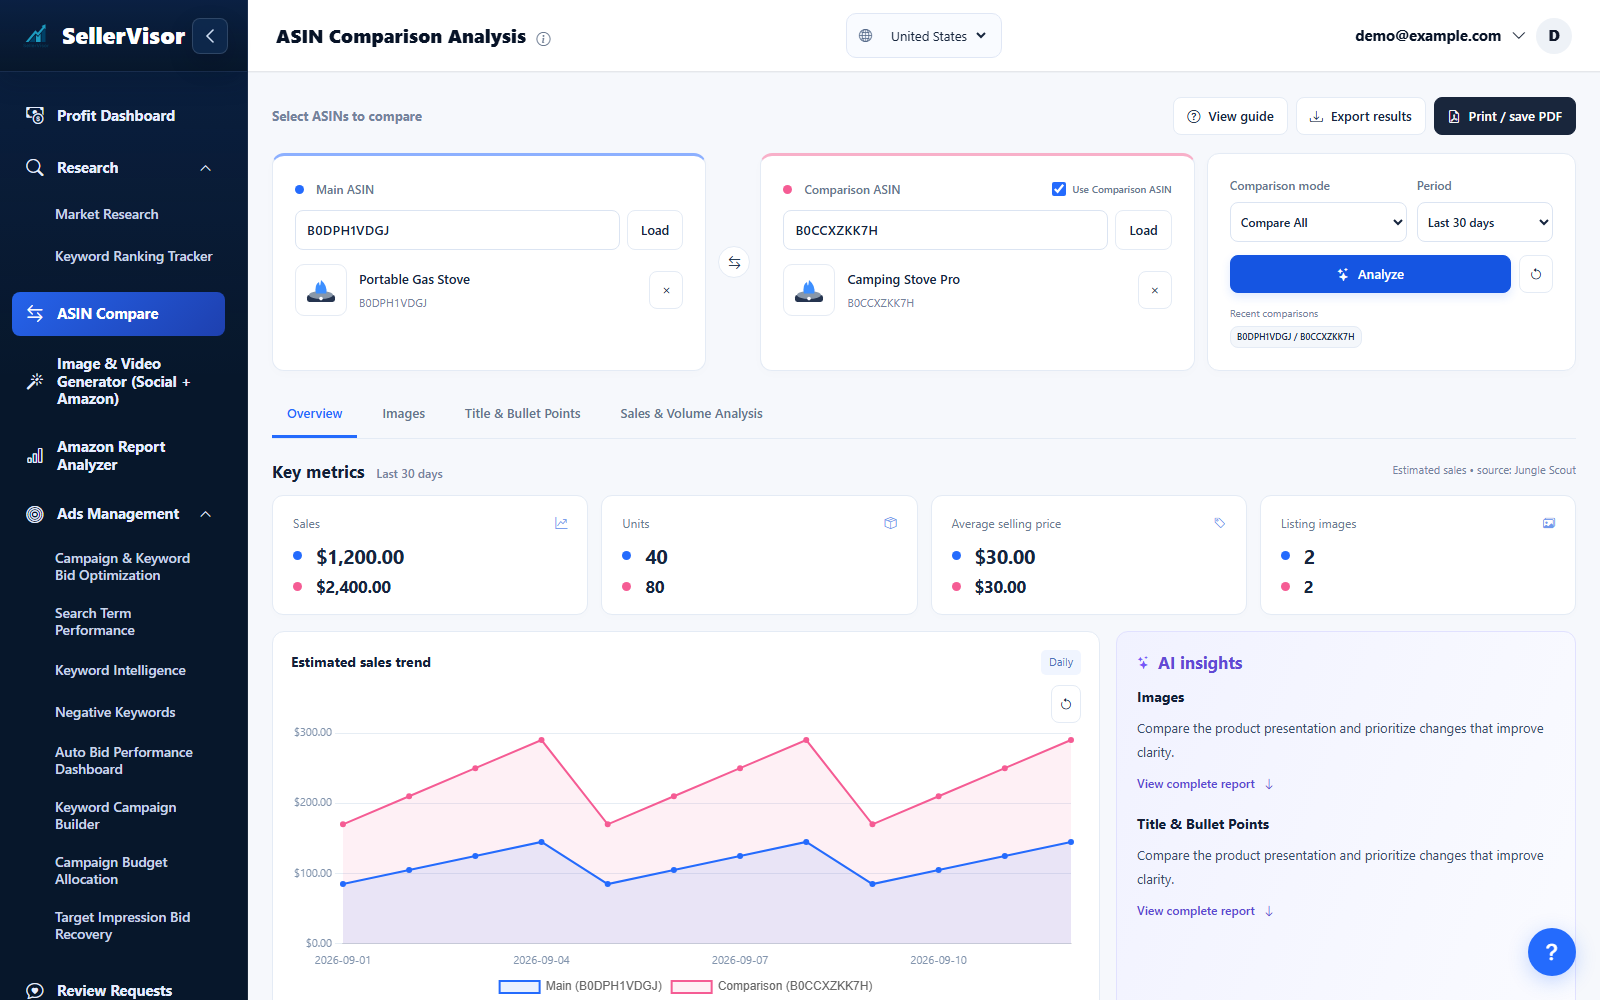
Load one or two ASINs and choose image, text, sales, or full analysis. Review the findings alongside the source product information before making changes.
1
Market research
See how your visuals actually sell the product
- Compare hero, lifestyle, infographic, and packaging images across your Main vs Comparison listings.
- Check framing, lighting, angles, overlay text, and brand consistency so the product feels trustworthy and easy to understand.
- Strong visuals should answer buyer questions about size, usage, contents, and benefits without forcing them to read every line of copy.
2
Market research
Use AI to refine titles and bullets that convert
- Compare your current title with the AI suggestion to make the main value clearer. Review proposed wording against Amazon requirements before publishing.
- Let AI propose bullet points using the structure feature → benefit → short proof or spec, then adjust them so they fit your brand voice and target audience.
- Read the “Why this is good” explanations next to each change to understand how clarity, benefits, and keyword focus have been improved.
3
Market research
Read performance like a dashboard, not a mystery
- Compare performance signals between your Main and Comparison ASINs to benchmark overall strength and momentum.
- Use the day-of-week table to spot which days respond best to pricing, ads, or promotional changes.
- Track 12-month trend lines to see seasonality, cliffs, and momentum shifts.
4
Market research
Download a shareable comparison report
- Generate a structured listing comparison report that summarizes image, copy, and performance gaps in one place.
- Download the report so product, creative, and advertising teams can align on the same data and action items.
- Use the report to plan next steps like reshooting images, rewriting bullets, testing price points, or scaling winning ASINs.
Screenshots are in English and may contain sample data. Available features depend on your plan, connections, and data.