Hello. Thank you to all customers who use SellerVisor.
The most difficult question when choosing a new product is "What to sell?" Products that are already selling well face strong competition, and it's difficult to know if products with weak competition have demand. Therefore, it's better to reverse the order. This method involves first finding search terms where demand is rising but competition has not yet intensified, and then reverse-engineering products from those keywords.
SellerVisor Opportunity Explorer displays recently rising keywords alongside competitive metrics, along with average metrics by category. This article is a tutorial that sequentially organizes the process of finding candidates using actual screens.
Step 1. Market Research > Open Opportunity Explorer
From the left menu, go to Market Research and select the Opportunity Explorer tab at the top. There are three tabs: Market Research, Opportunity Explorer, and Product Research, and the Opportunity Explorer is for "browsing entire categories and culling candidates."
Step 2. Read the Category Average Table
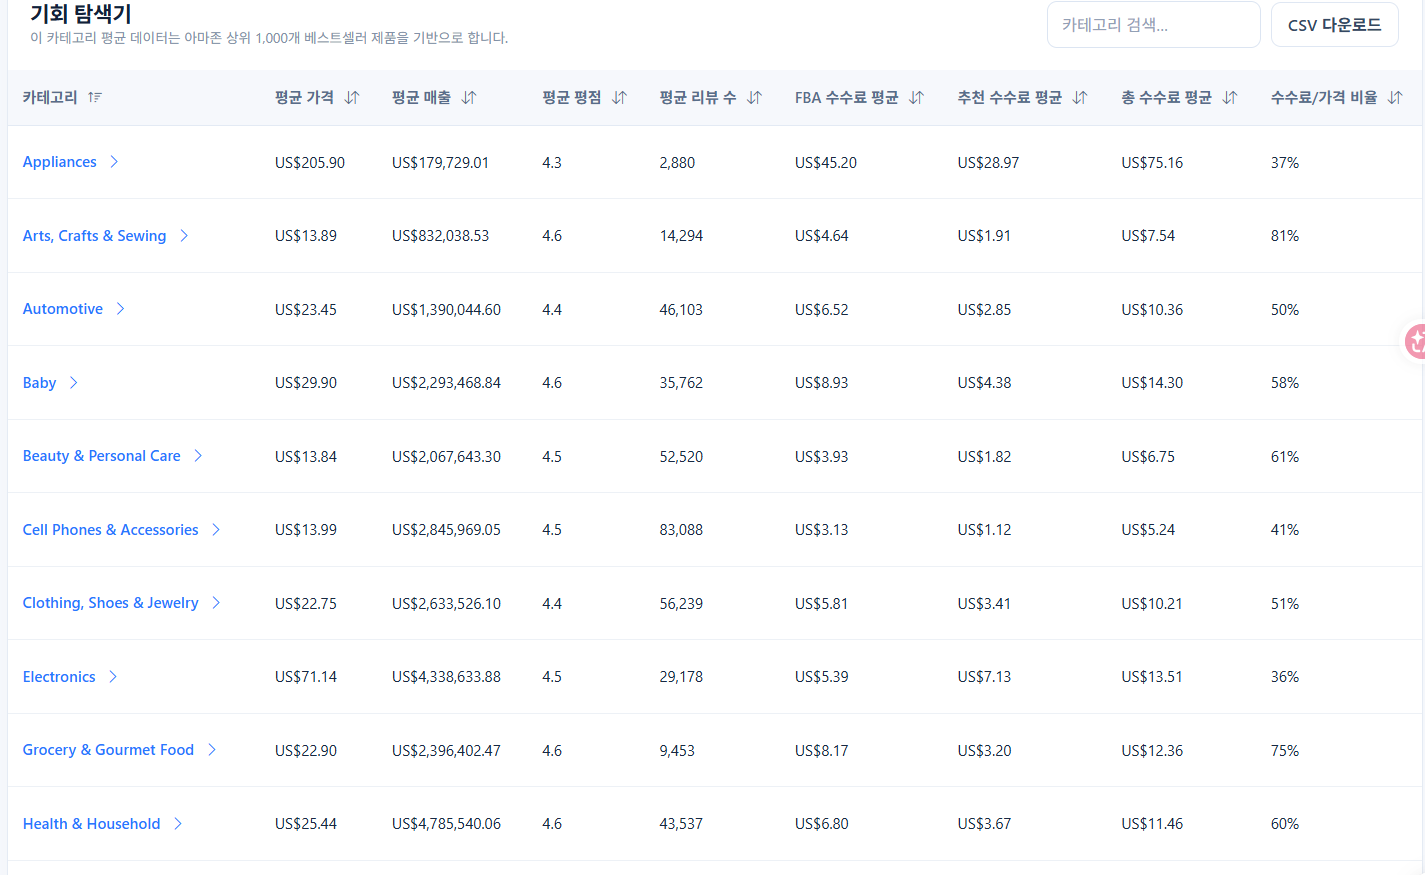
The first screen displays average data by category. It is calculated based on the top 1,000 bestsellers on Amazon, and the columns are structured as follows.
- Average Price · Average Revenue — the scale of earnings for one product in that category
- Average Rating · Average Review Count — the height of the review barrier
- Average FBA Fee · Average Referral Fee · Average Total Fee — cost structure by category
- Fee/Price Ratio — fee burden relative to price. If this ratio is high, it's difficult to profit from low-priced products.
For example, Appliances have an average price of US$205.90, average revenue of US$179,729.01, and a fee/price ratio of 37%. Toys & Games have an average price of US$10.30, average revenue of US$527,764.37, and a fee/price ratio of 65%, a completely different structure. Since the profit structure differs even with the same effort, this table is reviewed first at the stage of choosing a category.
Step 3. Select a Category to View Detailed Metrics
Clicking on a category in the table opens a detailed summary for that category. As an example, Pet Supplies has been selected.
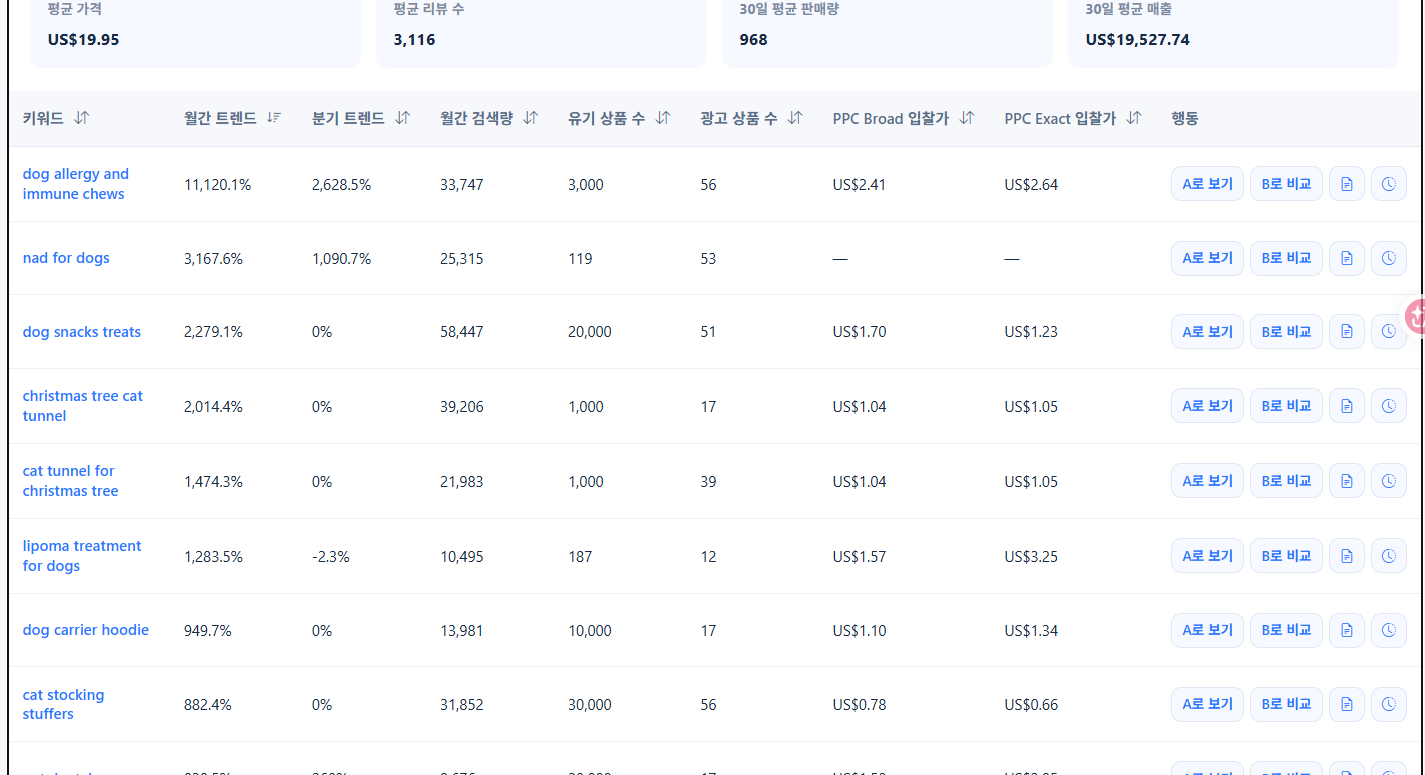
- Average Price US$19.95
- Average Review Count 3,116
- 30-day Average Sales Volume 968
- 30-day Average Revenue US$19,527.74
What we look at here is "whether this category has a price range and review barrier that I can manage." If the average review count is around 3,000, a strategy for accumulating reviews is essential when entering a new market.
Step 4. Read the Opportunity Keyword Table — The Core of This Feature
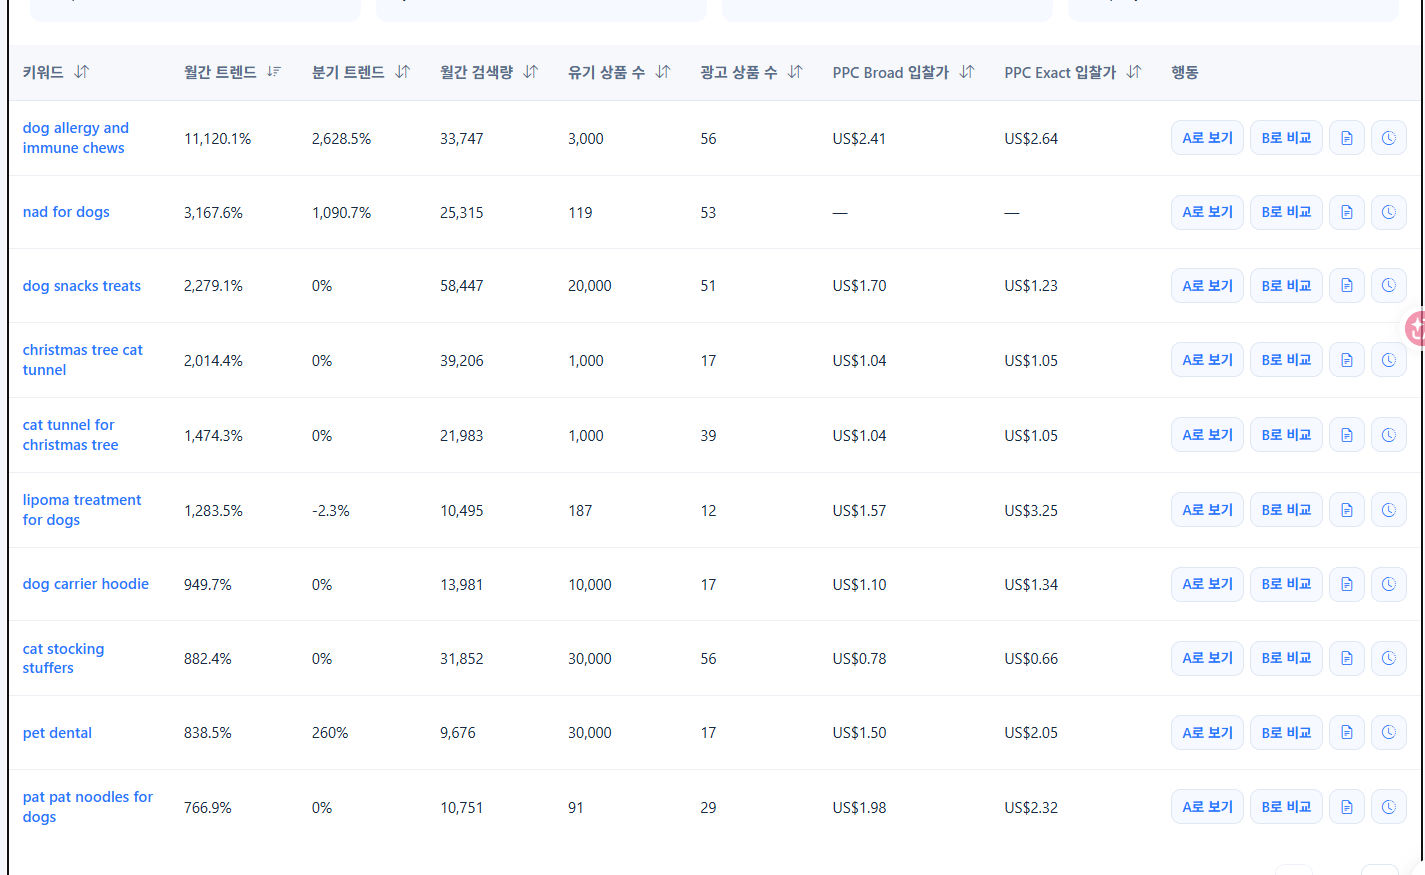
Below the same screen, rising keywords for that category are displayed. In this Pet Supplies example, 10 out of 20 are shown. The columns are as follows.
- Monthly Trend · Quarterly Trend — how much search volume has risen recently
- Monthly Search Volume — size of demand
- Organic Product Count · Sponsored Product Count — competition intensity. Smaller numbers indicate more open spots.
- PPC Broad · Exact Bid Price — cost when pushing with ads
- Action — View as A / Compare as B
Let's look at a few keywords actually listed in the table.
- dog allergy and immune chews — Monthly Trend +11,120.1%, Search Volume 33,747, Organic Products 3,000, Sponsored Products 56, Bid Price US$2.41 / US$2.64
- nad for dogs — +3,167.6%, Search Volume 25,315, Organic Products 119, Sponsored Products 53
- dog snacks treats — +2,279.1%, Search Volume 58,447, Organic Products 20,000, Sponsored Products 51
- lipoma treatment for dogs — +1,283.5%, Search Volume 10,495, Organic Products 187, Sponsored Products 12
- pat pat noodles for dogs — +766.9%, Search Volume 10,751, Organic Products 91, Sponsored Products 29
Step 5. Criteria for Selecting Candidates
1) Look at monthly trend and quarterly trend together. If only the monthly trend surges and the quarterly trend is 0%, it is highly likely to be seasonal or a temporary issue (e.g., christmas tree cat tunnel). Conversely, if both monthly +3,167.6% and quarterly +1,090.7% rise together, like 'nad for dogs', there is room to see it as a trend.
2) Look at the number of organic products relative to search volume. A small number of organic products means that there are still few products capturing this search term. Combinations with search volume but low organic product counts, such as lipoma treatment for dogs (Search Volume 10,495 / Organic 187) or pat pat noodles for dogs (10,751 / 91), stand out.
3) Also look at the number of sponsored products. Even if the number of organic products is small, if the number of sponsored products is large, ad spend competition is already underway.
4) Estimate entry costs with bid prices. PPC Broad·Exact bid prices are the baseline costs when pushing that keyword with ads. Keywords with high search volume and low bid prices are the first targets for testing.
Step 6. Research Directly with View as A
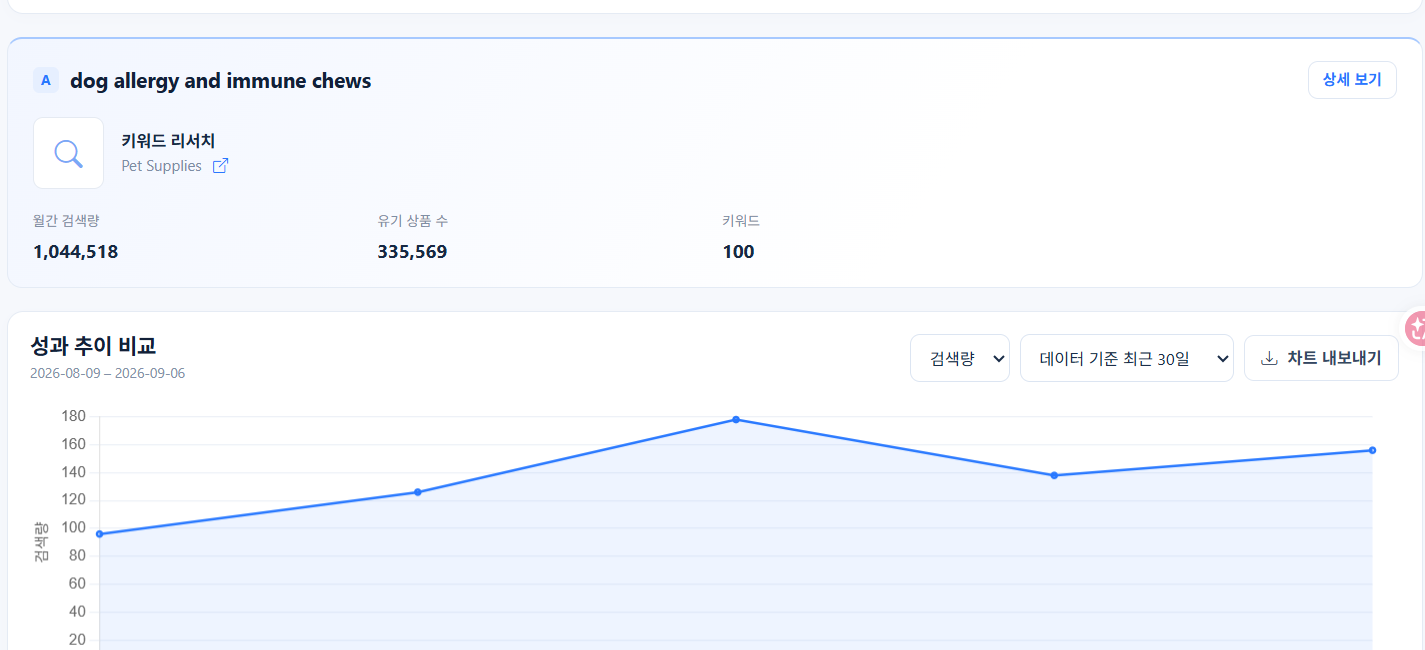
Once you've selected a candidate, click 'View as A' in the action column. The corresponding keyword will then be transferred to a single search in Market Research, and you can subsequently check search volume, organic product count, 100 related keywords, and PPC and exposure rankings.
For example, if you transfer 'dog allergy and immune chews' to 'View as A', you will get a monthly search volume of 1,044,518, an organic product count of 335,569, and 100 related keywords, and you can see which products are actually associated with that keyword. Clicking 'Compare as B' will immediately take you to a screen comparing two keywords side by side.
Step 7. Export List
The category average table can be downloaded as a CSV. When comparing multiple categories to decide which one to enter, it's more convenient to download the table and view them side by side.
It's good to follow this order
- In the category average table, narrow down candidate categories to 2-3 based on fee/price ratio and average revenue.
- In the category details, check entry difficulty using average price and review count.
- In opportunity keywords, select keywords where both monthly and quarterly trends are rising together, and the organic product count is low.
- Transfer to 'View as A' to check search volume and actual competing products.
Frequently Asked Questions
- Where do the numbers in the table come from? Category averages are based on Amazon's top 1,000 bestsellers, and sales/revenue estimates use Jungle Scout data. It is more accurate to use them for category-to-category comparison and trend analysis rather than as absolute values.
- Can such large numbers, like a trend of 11,000%, be trusted? These values appear when the denominator is small. Judge by looking at both the absolute search volume and the quarterly trend.
- Is a low organic product count a good keyword? It only has meaning if there's demand (search volume) along with it. If search volume is low and the organic product count is also low, the market does not yet exist.
- Can I decide on a product just by looking at keywords? Keywords are just the starting point. Conduct research with candidate keywords to confirm actual selling products and price ranges before making a decision.
- How do I distinguish seasonal keywords? If the quarterly trend is 0% but the monthly trend surges, it is highly likely to be seasonal or issue-related.
Usage Tips
- By comparing rising keywords for the same period across different categories, you can see trends in which categories demand is concentrated.
- Record candidate keywords along with search volume, organic product count, and bid prices in a spreadsheet, then check after two weeks to see if the trend continues.
- Once you've decided on keywords, register them for keyword rank tracking to record changes in organic and sponsored rankings, allowing you to measure performance after entry against the same standard.
- Once competing products are identified, use ASIN comparison analysis to compare images, titles, and revenue to formulate an entry strategy.