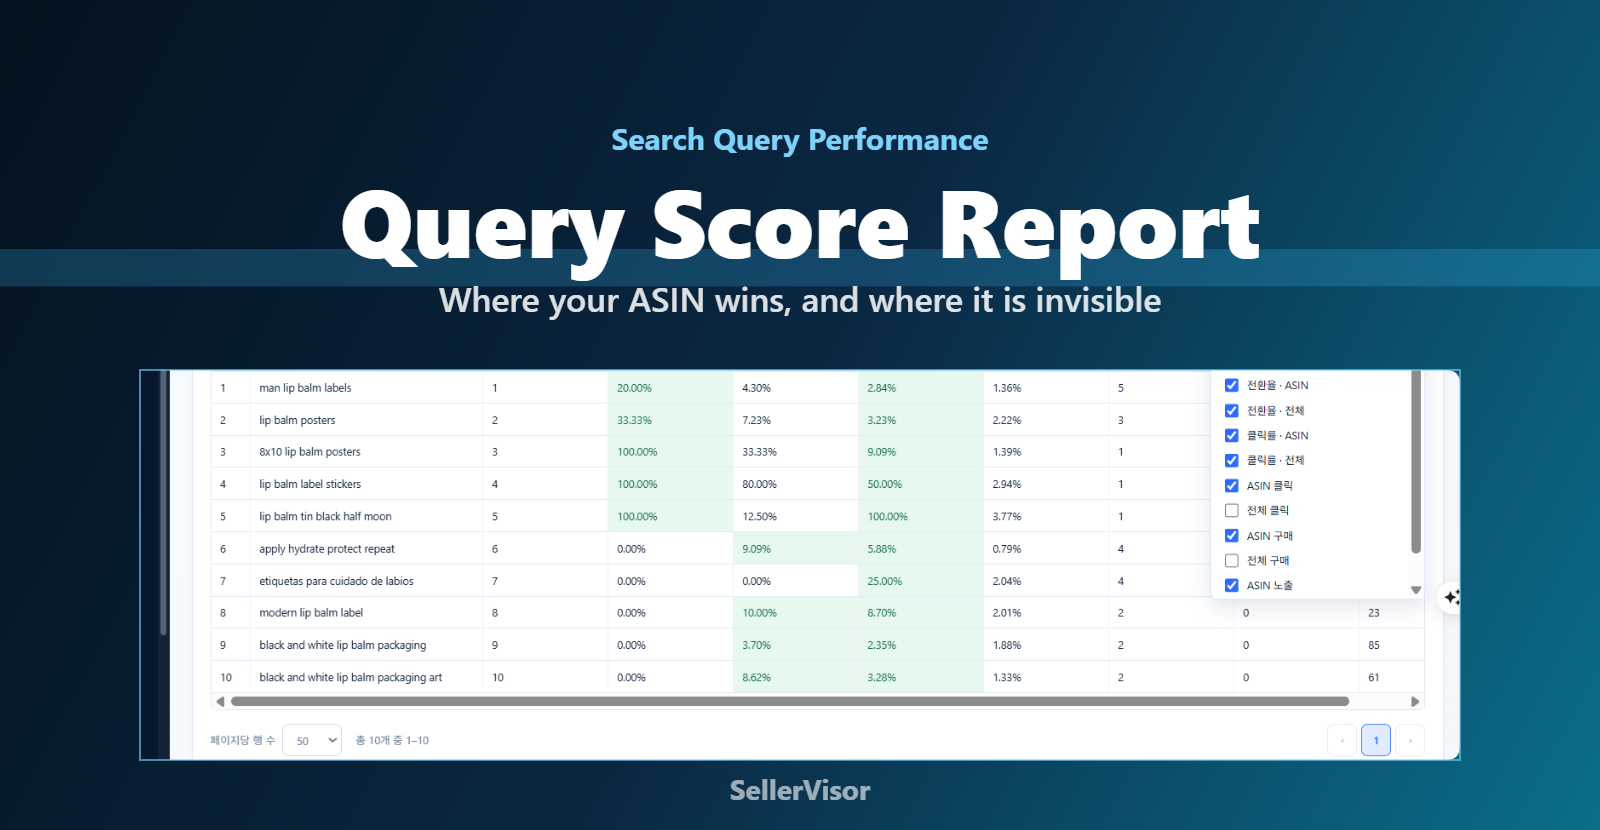
Hello. Thank you to all customers who use SellerVisor.
Advertising reports tell you how much your ad spent, but not how much the entire market moved for that search term. It's difficult to distinguish if low impressions are due to strong competition or the product not being visible. Amazon's Search Query Performance (SQP) report shows impressions, clicks, adds to cart, and purchases for the overall market and your ASIN for the same search term, broken down separately.
By comparing the market and your ASIN side-by-side for each search term, you can distinguish between search terms that sell well but are not visible, and those that are visible but do not sell.
Requirements
- Amazon Seller Central → Brands → Brand Analytics → Search Analytics → Search Query Performance
- Switch to ASIN view, select the period, and download the CSV in English.
- Only ASIN data is supported, not Brand data. Files downloaded in Brand view have a different column structure and are not recognized.
Step 1. Open Keywords by Query Score in the Report Analyzer
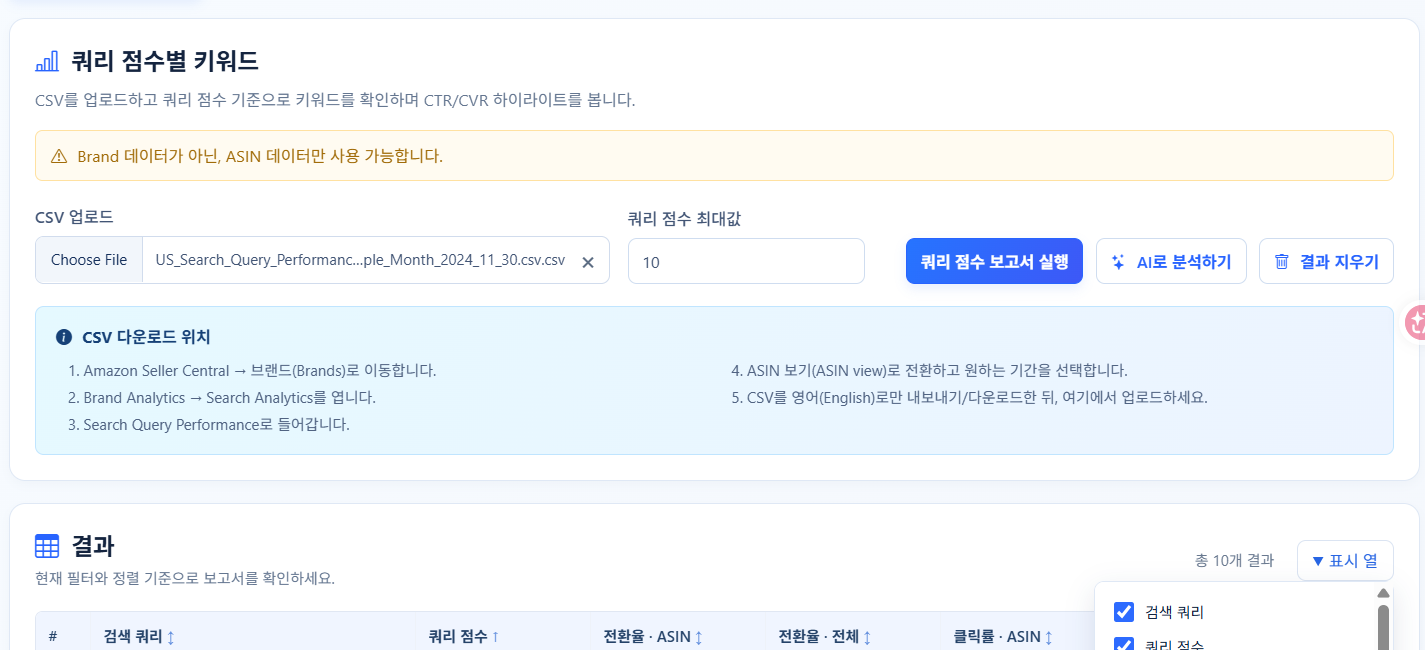
Select 'Keywords by Query Score,' the first tab among the three tools in the Amazon Report Analyzer. This tool is CSV-only and sorts search terms by query score, showing CTR and CVR compared to the overall market.
Step 2. Set the Maximum Query Score
The query score in the SQP report is a value ranked from 1 onwards, indicating how important a search term is to that ASIN. A score of 1 indicates the most important search term. The default value of 10 shows the top 10 queries. If you lower the score to 3, it shows only the top 3; if you raise it to 50, it checks up to the top 50.
Initially, it is efficient to understand the nature of top search terms with the default value of 10, then expand the range to view mid-ranking search terms.
Step 3. Read the Results Table
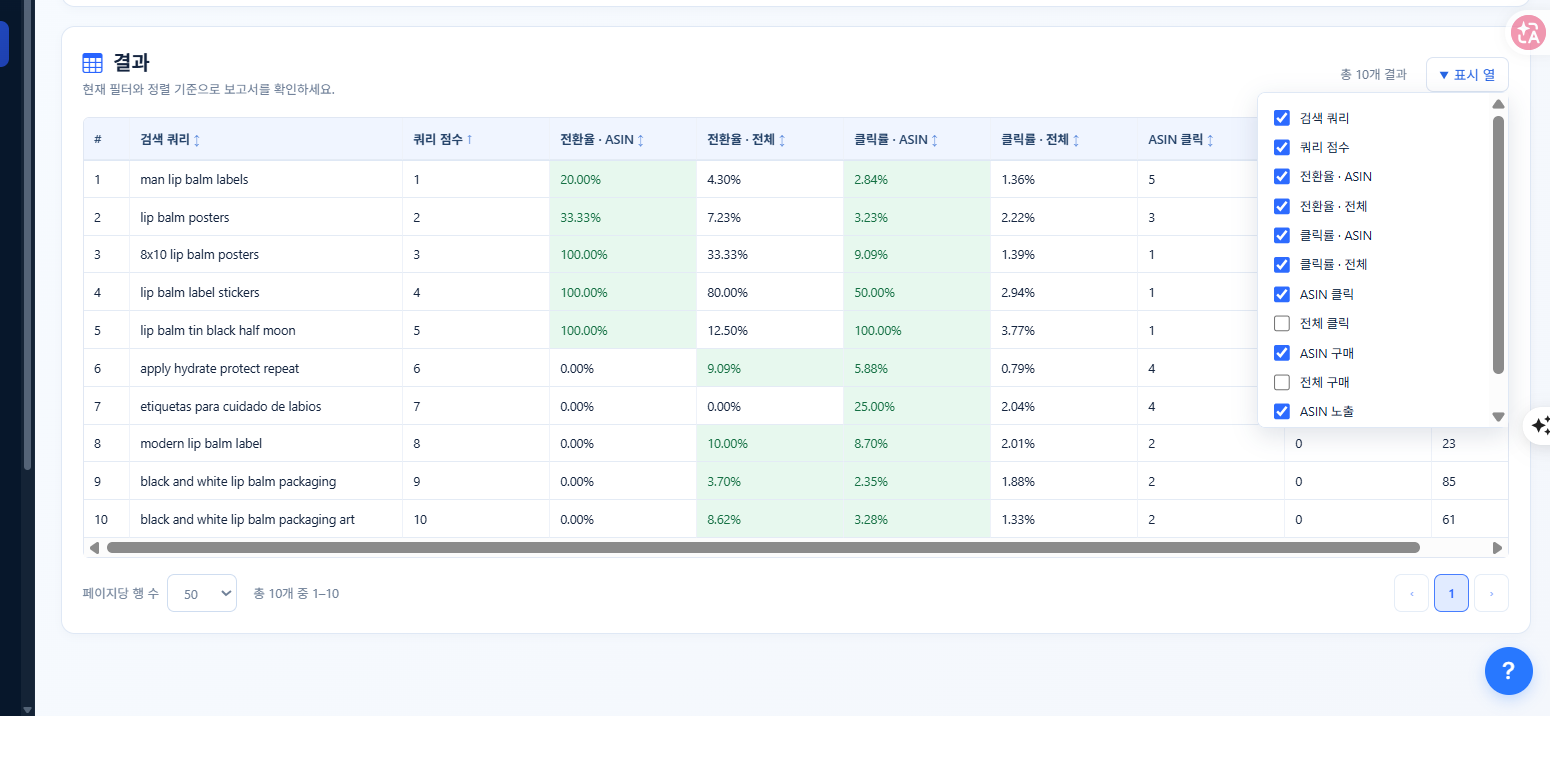
The table columns are Search Query, Query Score, Conversion Rate (ASIN), Conversion Rate (Overall), Click-Through Rate (ASIN), Click-Through Rate (Overall), ASIN Clicks, Overall Clicks, ASIN Purchases, Overall Purchases, ASIN Impressions, Overall Impressions. Values prefixed with ASIN represent your product's performance, while values prefixed with Overall represent the total market performance for that search term. If there are many columns, you can leave only the necessary items in the display columns.
The report used as an example contains 90 search queries for November 2024. The totals are as follows: Out of a total of 229,035 impressions, my ASIN had 1,431 impressions (0.62%); out of 3,571 total clicks, 112 were for my ASIN (3.14%); out of 1,065 total adds to cart, 41 were for my ASIN; and out of 126 total purchases, 5 were for my ASIN.
Step 4. Two Insights from the Numbers
First is conversion efficiency. My ASIN's click-through rate is 7.8%, nearly five times the market average of 1.6%. The purchase conversion rate after clicks is also 4.5%, higher than the market average of 3.5%. This means that if it gets impressions, both clicks and purchases perform better than the market average.
Second is impression share. Impression share is 0.62%, while purchase share is 3.97%. This means that out of 126 total market purchases for the same search term, 5 were for my ASIN. Good performance relative to impressions indicates that the bottleneck is impressions, not conversions.
Step 5. Analyze by Search Term
In the table, top queries and mid-ranking queries have different characteristics.
- For query scores in the 1-5 range, my ASIN's conversion rate is higher than the overall market. For example, a search term with a score of 1 had my ASIN's conversion rate at 20%, significantly outperforming the market's 4.3%, and for a score of 5, it was 100% versus 12.5%. This range represents search terms where the product already has competitiveness.
- For query scores in the 6-10 range, my ASIN's conversion rate was 0%, while the market saw conversions. This is a segment where clicks occurred but did not lead to purchases. Since the issue is not a lack of impressions or clicks but a broken conversion funnel, you should check the product detail page, price, inventory, and shipping conditions.
- There are also search terms where total clicks were 189, but my ASIN only had 2 clicks. This is a case where market demand is high, but my product is barely visible for that search term.
Step 6. What to Do with These Results
- For search terms with low impression share and high conversion rates, focus your advertising budget. Since conversion is already proven for these search terms, increasing impressions is likely to lead to sales.
- Incorporate these search terms into your product title and bullet points. This is a way to gain impressions without spending on advertising.
- For queries with 0 conversions, check if the search intent matches the product. If it doesn't match, organize it as a negative keyword; if it matches but still doesn't sell, revise the product detail page.
- Run the same report again after modifying your listing to check if both impression share and conversion rate have increased.
Step 7. Additional Features
You can leave only the necessary metrics in the display columns, and request a summary for groups of search terms by analyzing with AI. You can clear the screen with 'Clear Results' and upload other reports.
Frequently Asked Questions
- Where can I get the SQP report? It's in Seller Central under Brands → Brand Analytics → Search Analytics → Search Query Performance. You must have brand registration to download the report.
- How is it different from advertising search term analysis? Advertising search term analysis looks at how much your ad spent and its performance. SQP looks at how many impressions and conversions the overall market and your ASIN each received for that search term, regardless of advertising. Looking at both reports together clarifies the cause.
- What is the query score? It is the ranking of the search term's importance to that ASIN. A score of 1 is the most important search term, and as the number increases, relevance decreases.
- Why don't the results increase if I set a higher score? This tool primarily shows top results. While expanding the range includes search terms up to a higher score (meaning less important search terms), the priority remains on the search terms with lower scores (meaning more important search terms).
- Should I also look at search terms with small numbers? Conversion rates fluctuate greatly with small sample sizes. Only refer to a 100% conversion rate for search terms with 5 or fewer clicks, and prioritize search terms with accumulated clicks.
Usage Tips
- Look at impression share and purchase share together. If impression share is low but purchase share is high, expanding advertising is the right answer.
- Making separate notes of search terms with a large difference between ASIN Conversion Rate and Overall Conversion Rate will help prioritize listing improvements.
- For seasonal products, compare with the report from the same month last year. The November report includes year-end demand.
- It is efficient to extract negative keyword candidates from advertising search term analysis and then use SQP to check the market characteristics of those search terms.
- Once keywords are determined, register them in keyword rank tracking to record rank changes simultaneously.