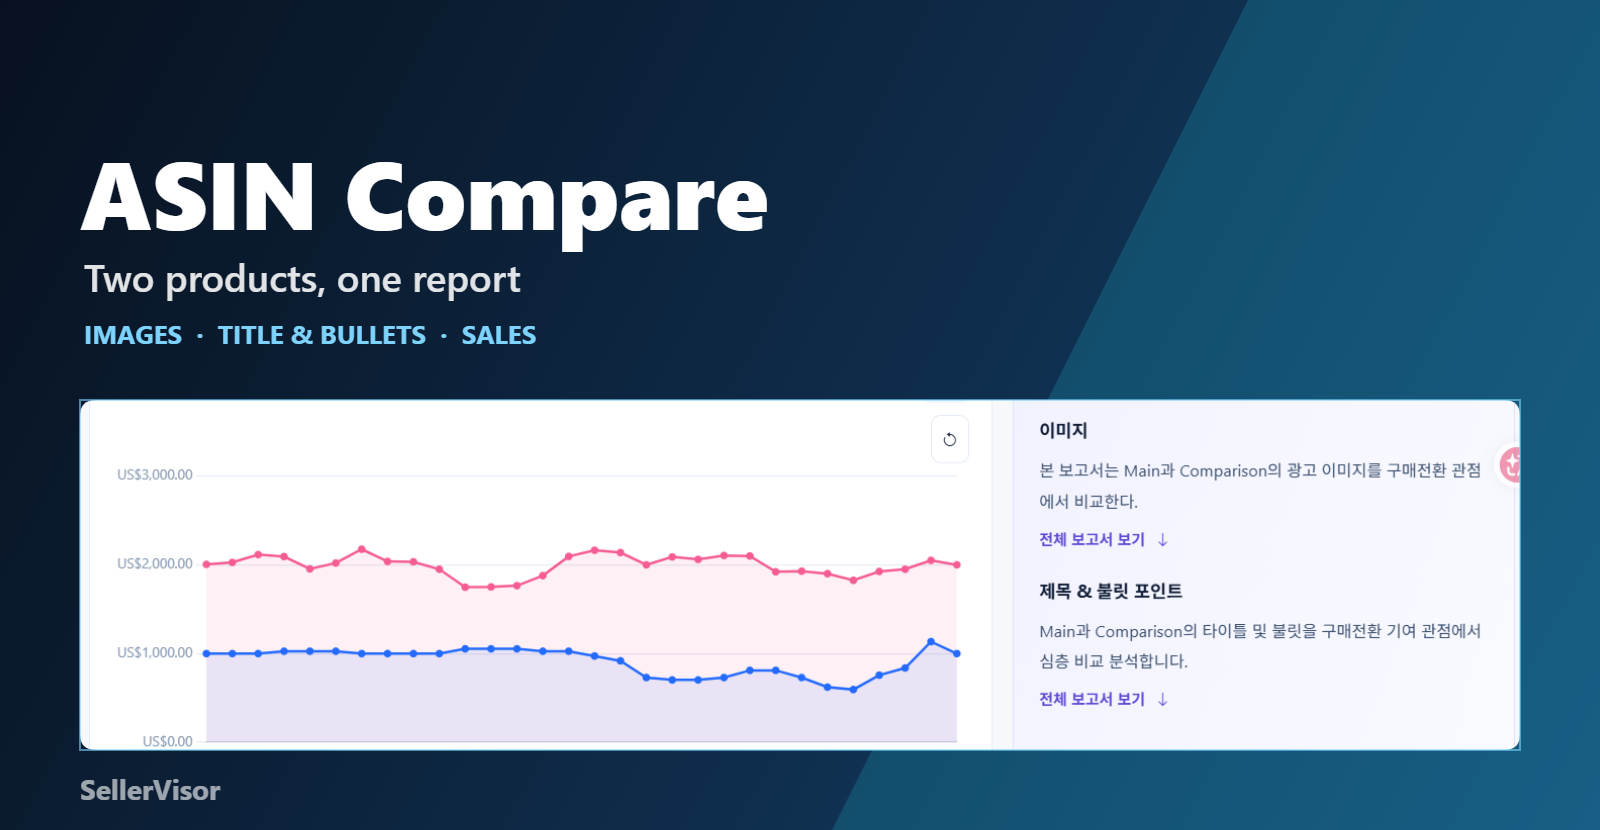
Hello. Thank you to all customers who use SellerVisor.
When we look at a single competitor product, we usually only see the price and reviews. However, what truly drives conversions lies before that. It's about how the main image is composed, what the title and bullets promise, and ultimately, which one sells more.
SellerVisor ASIN Comparison Analysis places two products side-by-side and compares three areas at once: images, title/bullets, and sales/quantity sold. This article is a tutorial that systematically outlines the process of comparing two actual products using the full comparison mode.
Products Compared
- Main · B0CDC428ZN — Caulipuffs Variety Pack (0.75oz × 12봉)
- Comparison Target · B0D3FL81SV — Hippeas Chickpea Puffs Blazin' Hot (0.75oz × 18봉)
Both are in the Puffed Snacks category within Grocery & Gourmet Food, and since they are individually packaged snacks, they can be compared under the same conditions. The comparison period is the last 30 days (2026-08-21 ~ 2026-09-19).
Step 1. Open ASIN Comparison Analysis and Select Marketplace
From the left menu, navigate to ASIN Comparison Analysis, and the ASIN selection area for comparison will appear. First, select the marketplace to use (US · Canada · Japan · Mexico). If the country is different, the price and ranking of the same product can change completely, so you must choose the marketplace where the products to be compared are located.
Step 2. Load Main ASIN and Comparison Target ASIN
Enter your product (or the benchmark product) in the Main ASIN field, enter a competitor product in the Comparison Target ASIN field, and click Load for each. If the product name and main image are displayed together, it has been loaded successfully. You can also compare two competitor products instead of your own product.
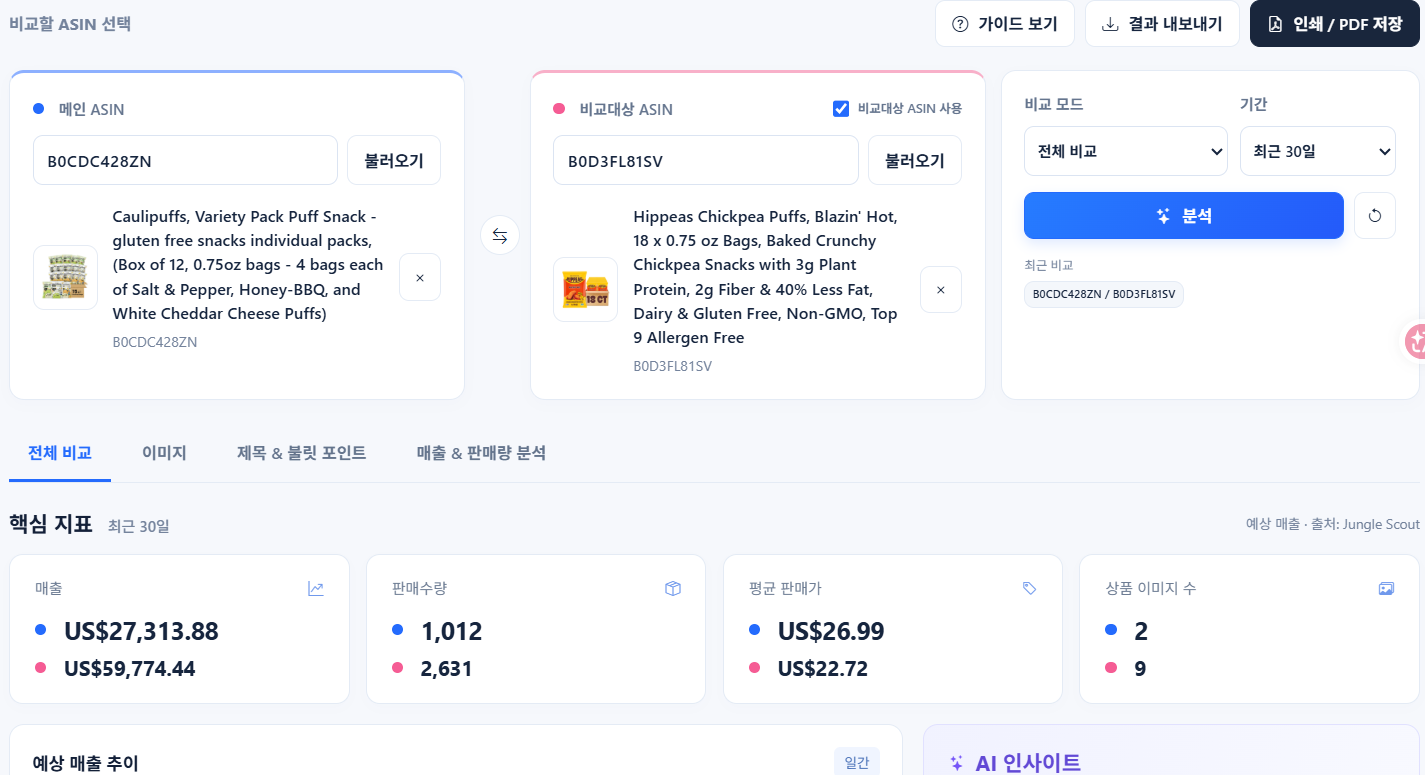
Step 3. Comparison Mode is 'Full Comparison'
There are four comparison modes.
- Full Comparison — Analyzes images, title/bullets, and sales/quantity sold. This mode is recommended for the first viewing.
- Image Comparison — Only views main image composition and conversion contributing factors.
- Title & Bullet Comparison — Compares the messages in the product name and bullet points.
- Sales & Quantity Sold Comparison — Quickly checks numbers only.
For the period, choose from the last 30 days · 90 days · 180 days · last 12 months. To determine if it's a short-term fluctuation or seasonality, it's best to look at both long and short periods together.
Step 4. Run Analysis
After completing the settings, click Analyze to load product and sales data. Because it reads both product images and title/bullets to generate AI insights, it takes a little longer than just loading sales data.
Step 5. View Key Metrics First
The first screen of the results displays key metrics for the period side by side.
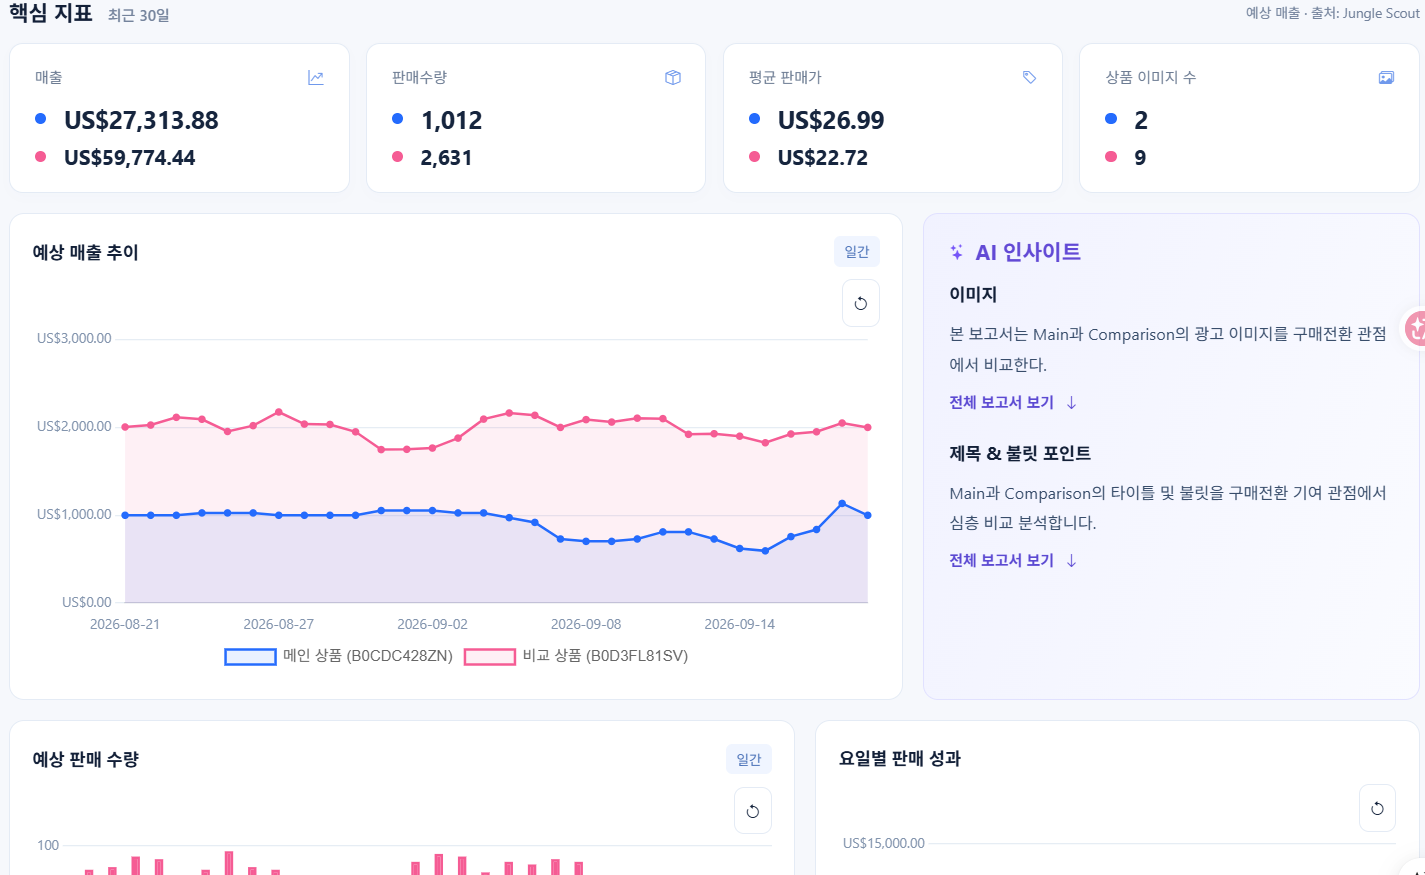
- Sales — US$27,313.88 vs US$59,774.44
- Quantity Sold — 1,012 vs 2,631
- Average Selling Price — US$26.99 vs US$22.72
- Number of Product Images — 2 vs 9
The number that immediately stands out here is the number of product images: 2 vs 9. These are two products with a 2.6x difference in sales volume, yet there's a difference of 7 images. By viewing the sales trend graph together, you can see if one side has consistently been above the other, or if the gap widened from a specific point.
Step 6. Check Differences and Growth Rates in the Period Summary Table
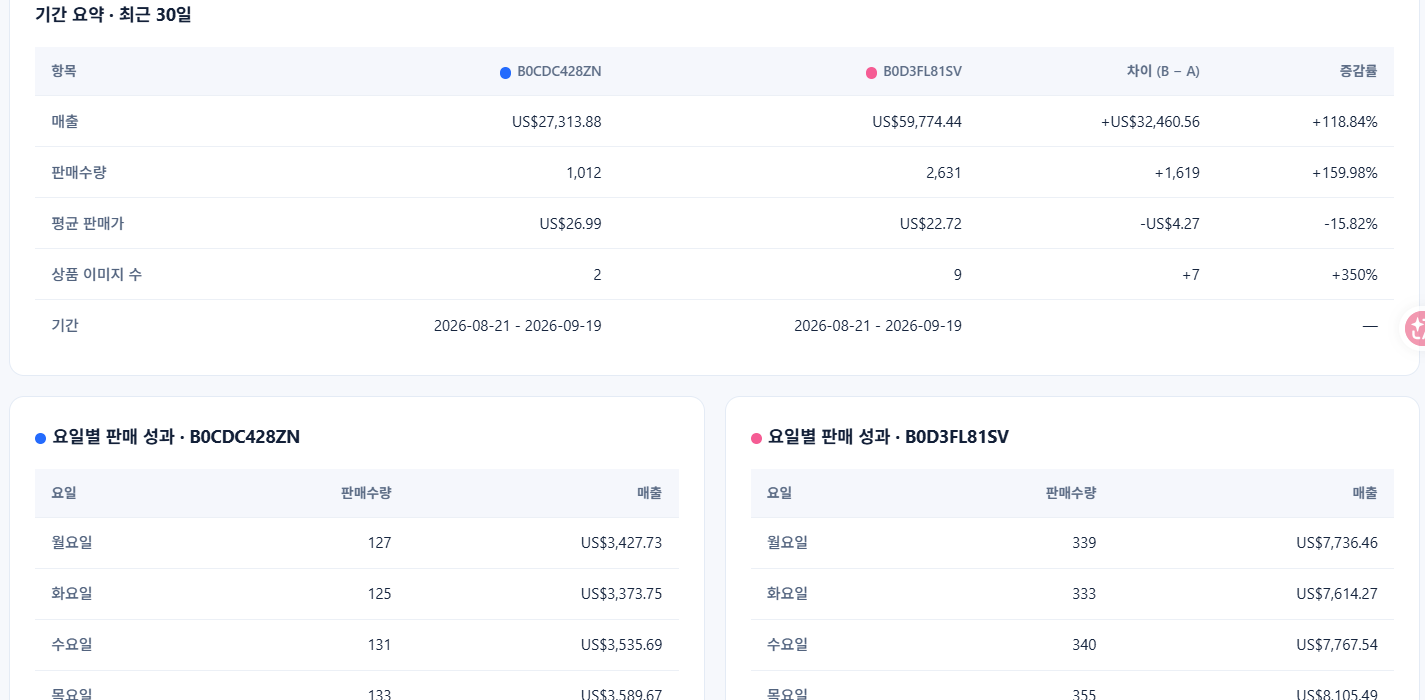
The period summary table below the key metrics shows the difference (B − A) and growth rate for the two products together.
- Sales +US$32,460.56 (+118.84%)
- Quantity Sold +1,619 (+159.98%)
- Average Selling Price −US$4.27 (−15.82%)
- Number of Product Images +7 (+350%)
Dividing the numbers this way makes interpretation easier. The comparison product has a 15.8% lower price but 160% higher sales volume. In other words, it's a structure where they gained volume by lowering the price, and the difference in the number of images is overlaid on this.
Step 7. Timing with Daily Sales Performance
The daily table is used to determine advertising and inventory timing. In this comparison, sales for both products were concentrated on Friday and Saturday (Main: Fri 184 · Sat 177, Comparison Target: Fri 453 · Sat 446). If a pattern of spending budget during the week and running out of stock on weekends repeats, it's better to prepare exposure and inventory before the weekend.
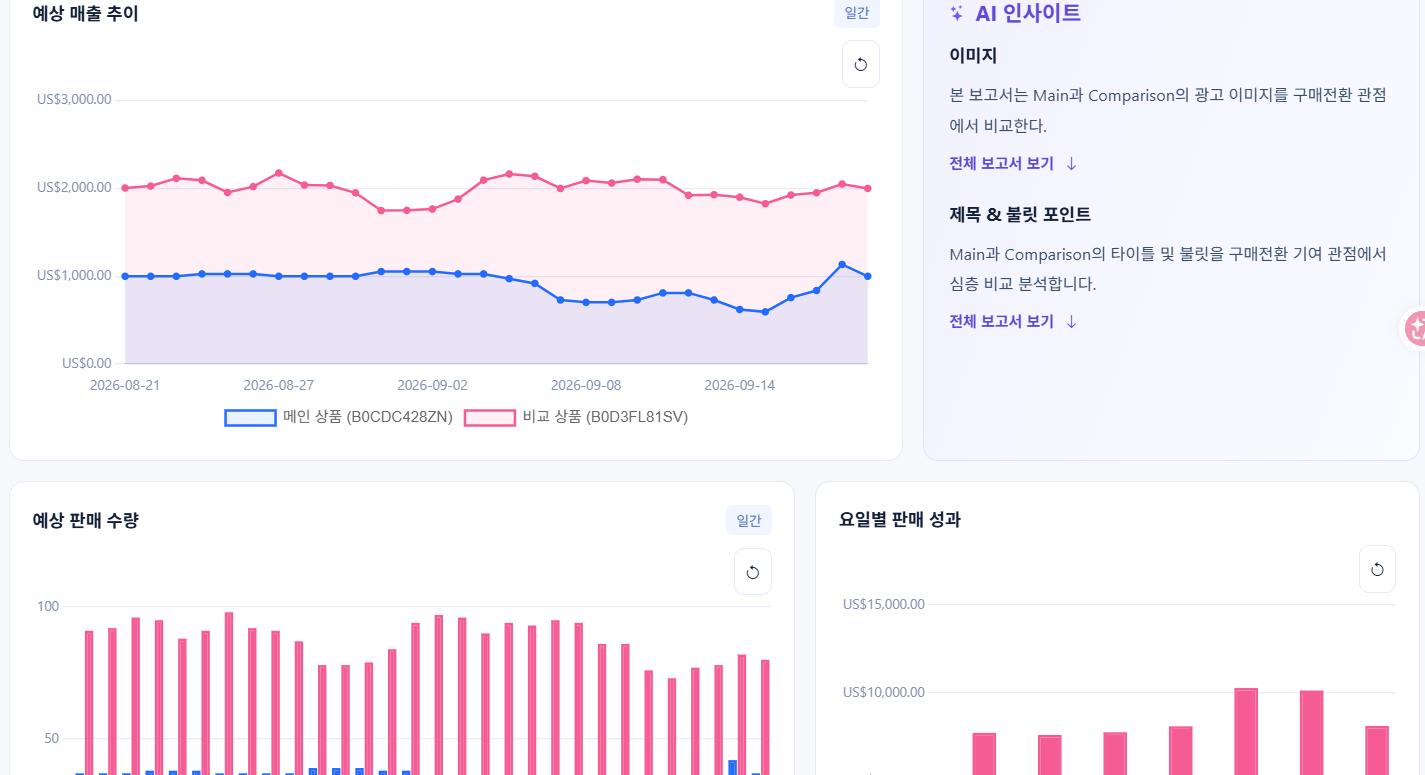
Step 8. Three Types of AI Insights
AI insights are provided in three categories.
- Images — Compares advertising images from a conversion perspective.
- Title & Bullet Points — Compares product names and bullets from a conversion contribution perspective.
- Estimated Quantity Sold — Summarizes the trend of quantity sold within the period.
Clicking "View Full Report" on each card opens a detailed analysis.
Step 9. Reading the Image Analysis Report
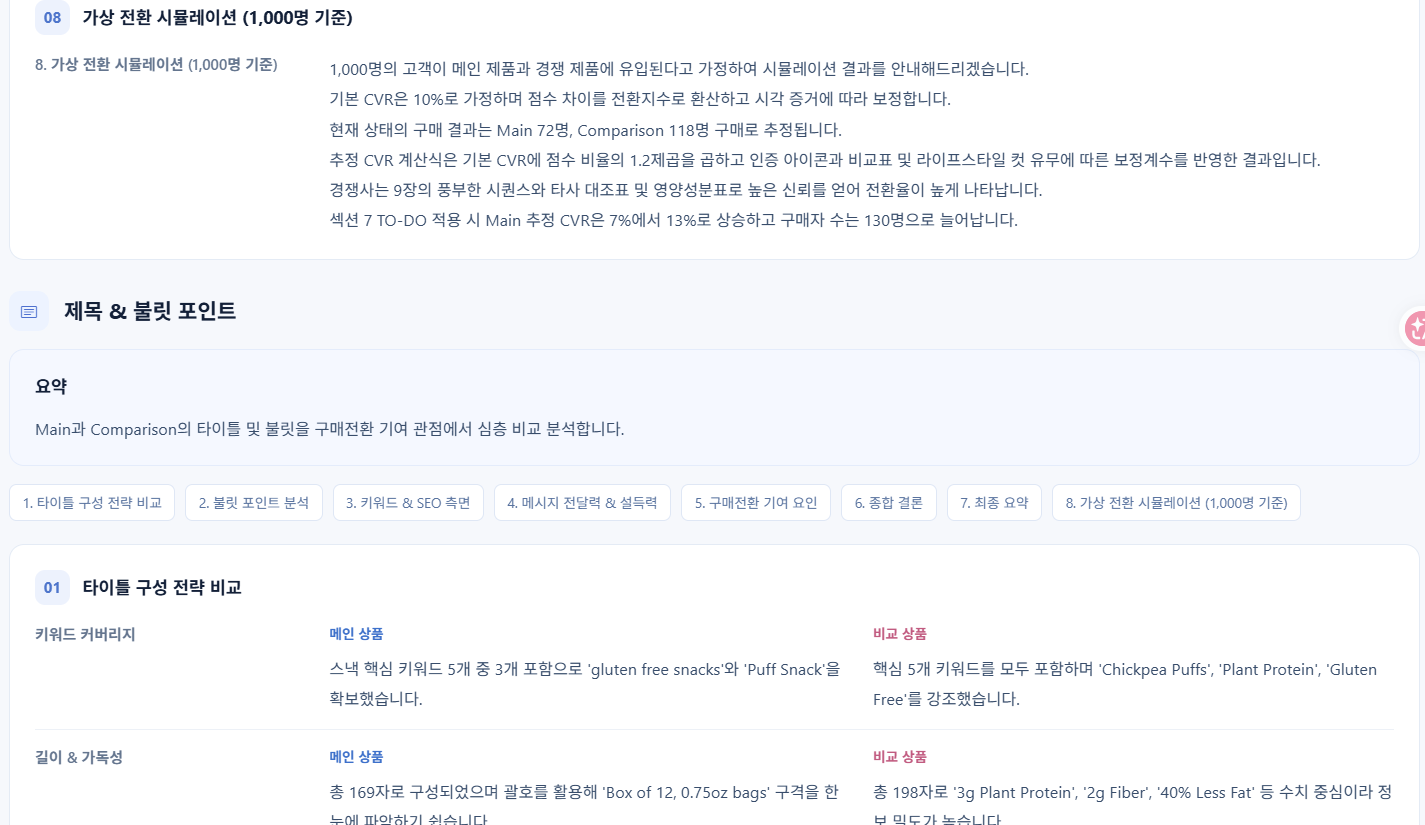
The image report can be read in order. The sequence is: 01 Image Composition Strategy Comparison → 02 Message Delivery Analysis → 03 Target Customer Perspective → 04 Visual and Reliability → 05 Conversion Contributing Factors → 06 Comprehensive Conclusion → 07 Final Summary → 08 Virtual Conversion Simulation.

08 Virtual Conversion Simulation shows how much the conversion difference translates into sales when 1,000 identical traffic users enter. This is the section for confirming the gap from a conversion rate perspective, not ranking or exposure.

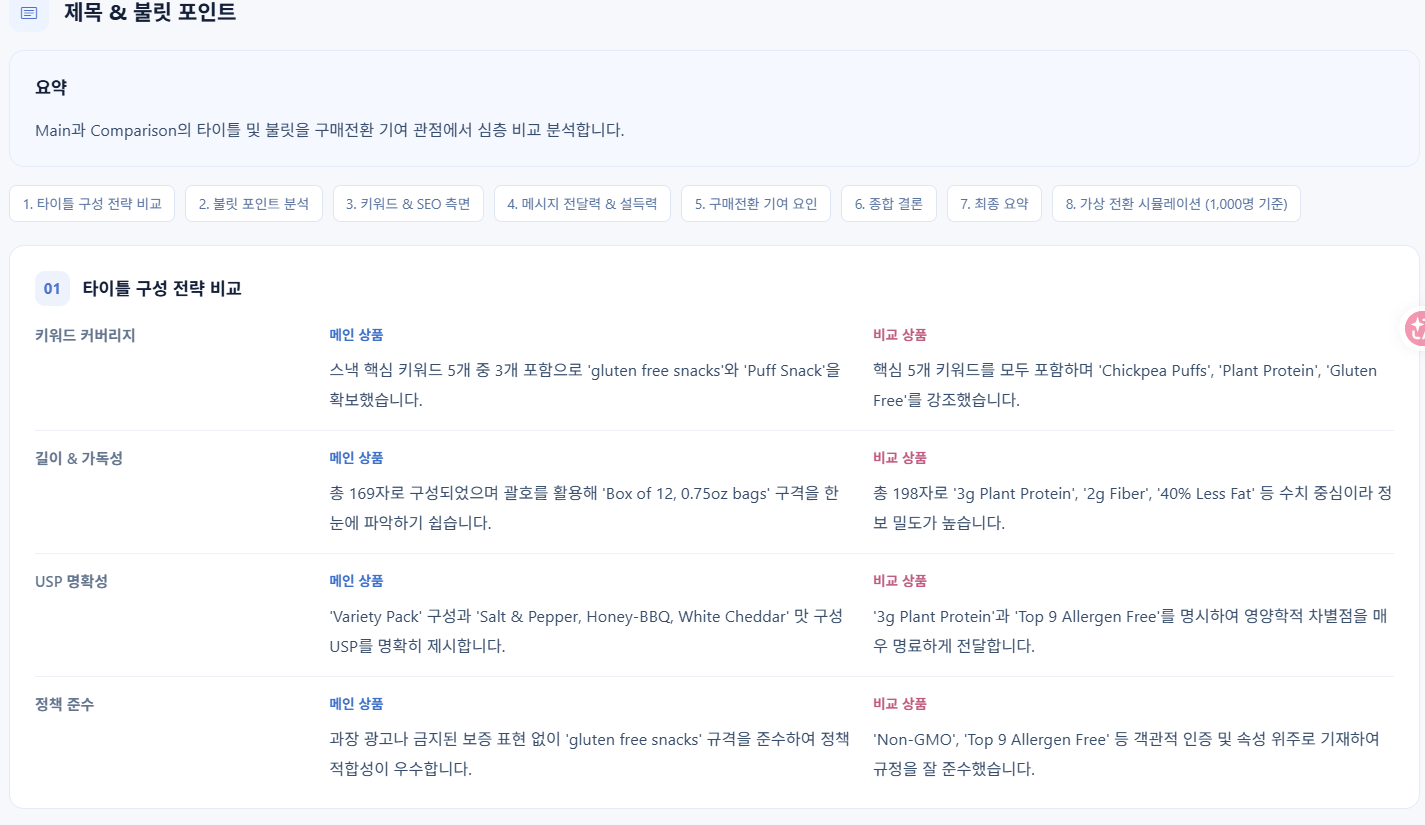
Step 10. Title & Bullet Analysis
The title and bullet report compares the same two products by dividing them into product name, bullet points, and size categories. Because it directly reveals what the bullets promise and what information might be missing, it can be immediately referenced when revising your product's bullets.
Insights Gained from This Comparison
1) The number of images is a fundamental condition for conversion. The main product has 2 images, while the comparison product has 9 images. If you don't fill the image slots allowed by Amazon, the comparison itself starts at a disadvantage.
2) The lower-priced product is winning. A product with an average selling price 15.8% lower has 160% higher sales volume. However, sales are +118.84%, indicating a structure where they increased sales by gaining volume.
3) The difference widens on weekends. Sales for both products are concentrated on Friday and Saturday, but the absolute gap is also largest during that period. Who captures weekend exposure better creates the monthly difference.
4) The next action is images and bullets. Sales and quantity sold are results, while images and title/bullets are inputs we can change. You can directly transfer the improvement points from the report to your action list.
Step 11. Export Results
Once the comparison is complete, you can save the data as a file using "Export Results" at the top, or create a report-style PDF using "Print / Save as PDF". These two functions are convenient when sharing with your team or clients.
Frequently Asked Questions
- Which products should I compare? Products in the same category and with similar packaging are easier to interpret. It is most practical to include products that directly compete with yours.
- How long does a full comparison take? It takes longer than just loading sales data. This is because it analyzes both images and text.
- Why is the number of images important? Images are the material buyers look at when evaluating a product. If slots are empty, you are competing without sufficient judgment material.
- What is the source of the sales data? We use Jungle Scout estimates. It is more accurate to interpret it as a relative comparison between two products rather than absolute values.
- Can I use it even if I don't have my own product? Yes. You can compare two competitor products to analyze market conversion factors.
Usage Tips
- It's quicker to first look at the three aspects: number of images, average price, and quantity sold, and then use AI insights to understand the reasons.
- Changing the period to 30 days and 180 days allows you to distinguish between short-term events and structural differences.
- Switching the comparison mode to "Image Comparison" allows you to re-examine the same product solely from an image perspective, which can be directly used for listing improvement tasks.
- It's a good idea to run the comparison results once before and after listing modifications to record changes.
- When used in conjunction with market research's two-product comparison, sales structure can be identified through research, and conversion factors through ASIN comparison analysis.